Team: Hayley Song, Tuyen Bui, Deborah Chen
Remix Technique: Map
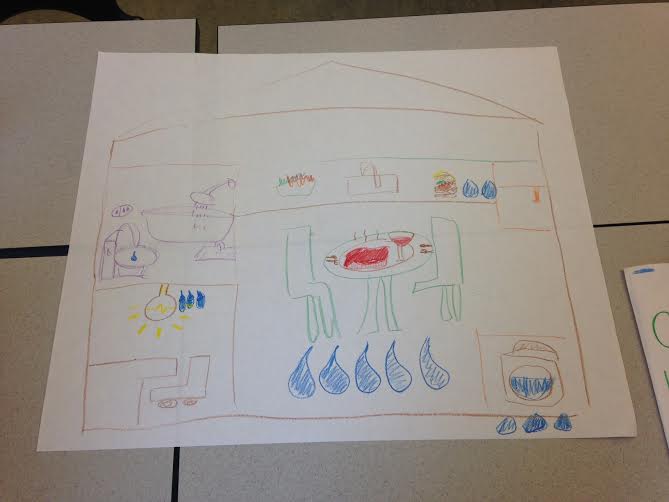
We used mapping as the visualization remix method to represent various direct and indirect water consumption in a household. To this end, we decided to draw an outline of a house and map different uses of water inside the house.
The data shown in the original infographic was for a period of 24 hours, but we decided to construct a story by focusing on our daily actions rather than the flow of time. Additionally, the original visualization shows a comparison of the water usage between appliances with different levels of efficiency (e.g. high efficiency washing machine vs regular), but we’ve chosen to focus just on regular usage and make this the dominant narrative.
The size of each room is proportional to the amount of water that directly or indirectly results in water waste.
Each room shows the key causes of water waste within the room. The kitchen is drawn the biggest and is placed in the center of the house to highlight it produces the most water waste in the house. The steak and wine, in the middle of the kitchen are the major causes of indirect water waste in the kitchen. The bathroom has a bathtub, a shower and a sink; the laundry room contains a washing machine.
We indicated the amount of waste by the size and the number of water drops under each component. Future work would involve adding the numerical quantity of how much water was used.