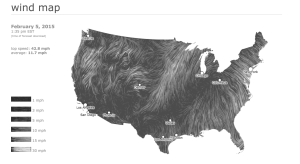
Wind is a source of energy that is readily available worldwide. When harnessed properly, it can provide continuous energy to households irrespective of the time of day (as is the case with solar power.) The limiting factor to the utility of wind power is wind availability at certain geographic locations. In some locations wind is abundant, while in other locations, it is not. Moreover, the velocity of the wind at a given location greatly affects the operating speed at which wind turbines are functional, as high wind speeds can damage the generators in the rotors of these machines. The figure below shows a visualization of the location and speed of surface winds in the US, in real-time. The surface wind data is from the National Digital Forecast Database (NDFD.) The authors specifically state that the data is not to be used to fly planes, sail boats or fight wildfires!
This information is crucial in the planning, siting, and sizing of wind farms. Wind farms are useless if they are located in areas with intermittent or variable wind patterns. This data visualization can also play an important role in city planning. For example, city planners could utilize such data in determining where to, locate a new high-rise development or park, as wind speeds can be detrimental to development.
This visualization communicates the overall picture in a meaningful way; however, a better picture can be depicted. For instance, the addition of color scale could immediately communicate where best suited sites for wind farms based on location.
Source: http://hint.fm/wind/
