Mike Bostock’s algorithm visualizations were not my first thought in response to the phrase “data presentation.” He also does a lot of standard data presentations, too, that I could have chosen to talk about. But his algorithm visualizations are among my favorite things to look at, and arguably highlight (as well as leave out) aspects of data presentation that might merit some meta-inspection, so I thought they’d be worth examining anyway.
Algorithms are often used to process data, but also to generate it. There are quite a few algorithms featured in the essay, but my favorites are the three described for generating a uniform-looking random sampling of points throughout a space. So, it’s definitely geared towards computer science enthusiasts in its content, but still attractive enough to engage the less geeky among us. It’s able to paint a less technical macro picture as well as a more detailed micro picture.
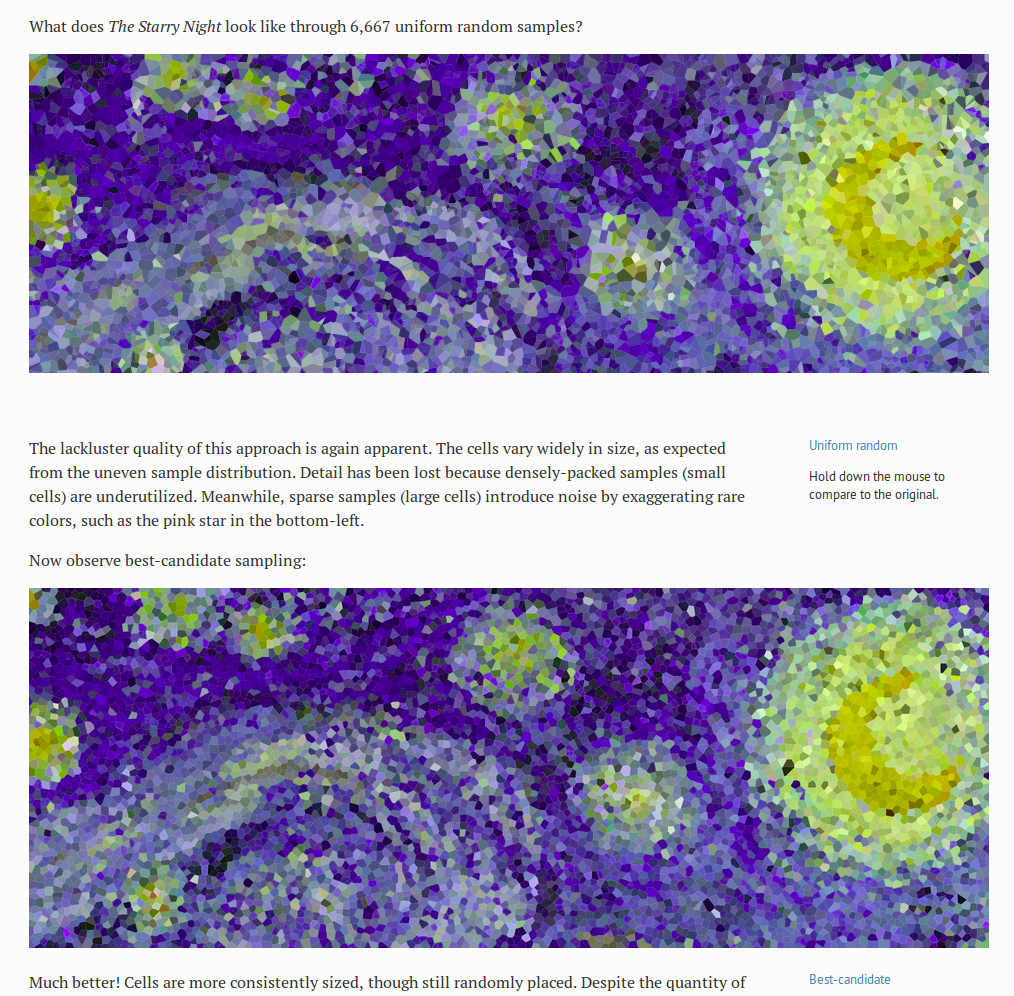
The motivating illustrative examples are the three versions of Starry Night, produced by using each algorithm to sample points, and then coloring the area closest to each point the same color as the point- a kind of compression of the image. This division of the space into cells defined by the point they are closest to is called a Voronoi diagram. But even without knowing precisely what that means, from the pictures it is easy to get an intuitive sense both for what the sampling does to the image, and why we would want to do it. The point of the article and the images is not to teach the reader what a Voronoi diagram is, especially when they are likely to already know or look it up if they care, but to give insight into the algorithms, and perhaps more importantly, to describe by example how visualizations can be used to teach and learn about algorithms.
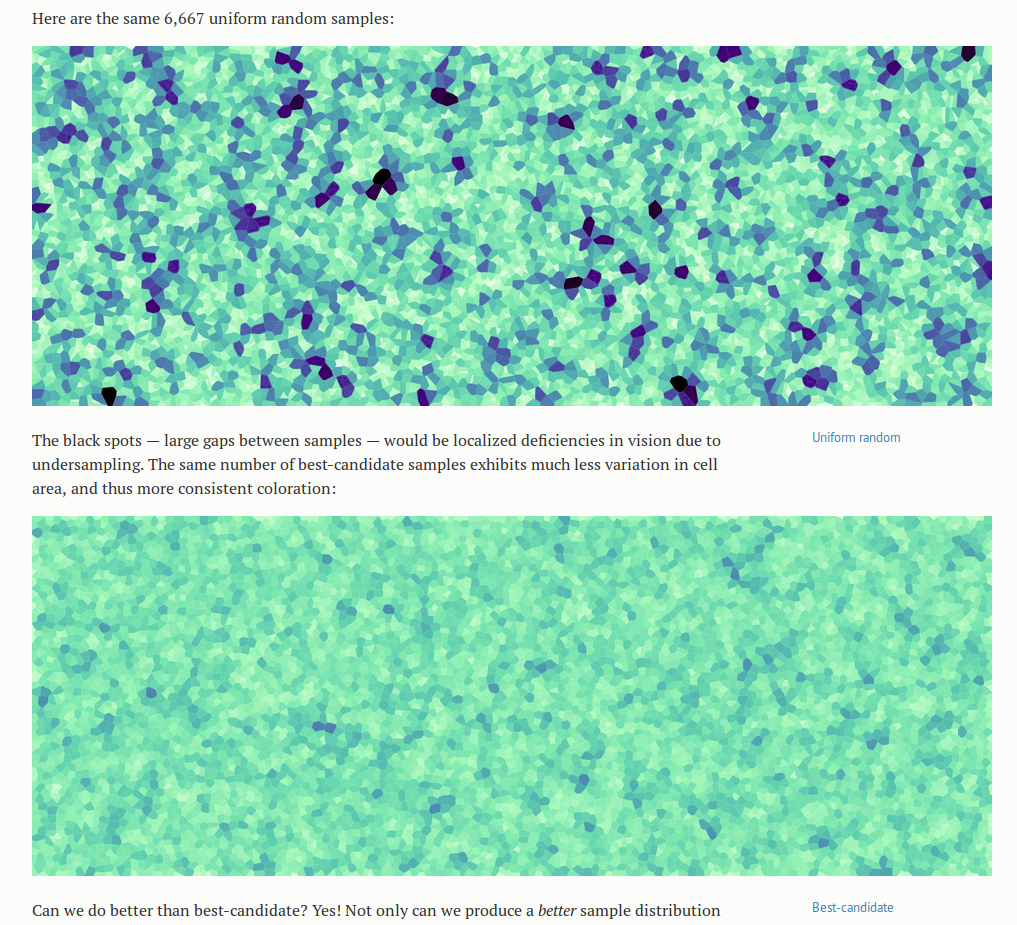
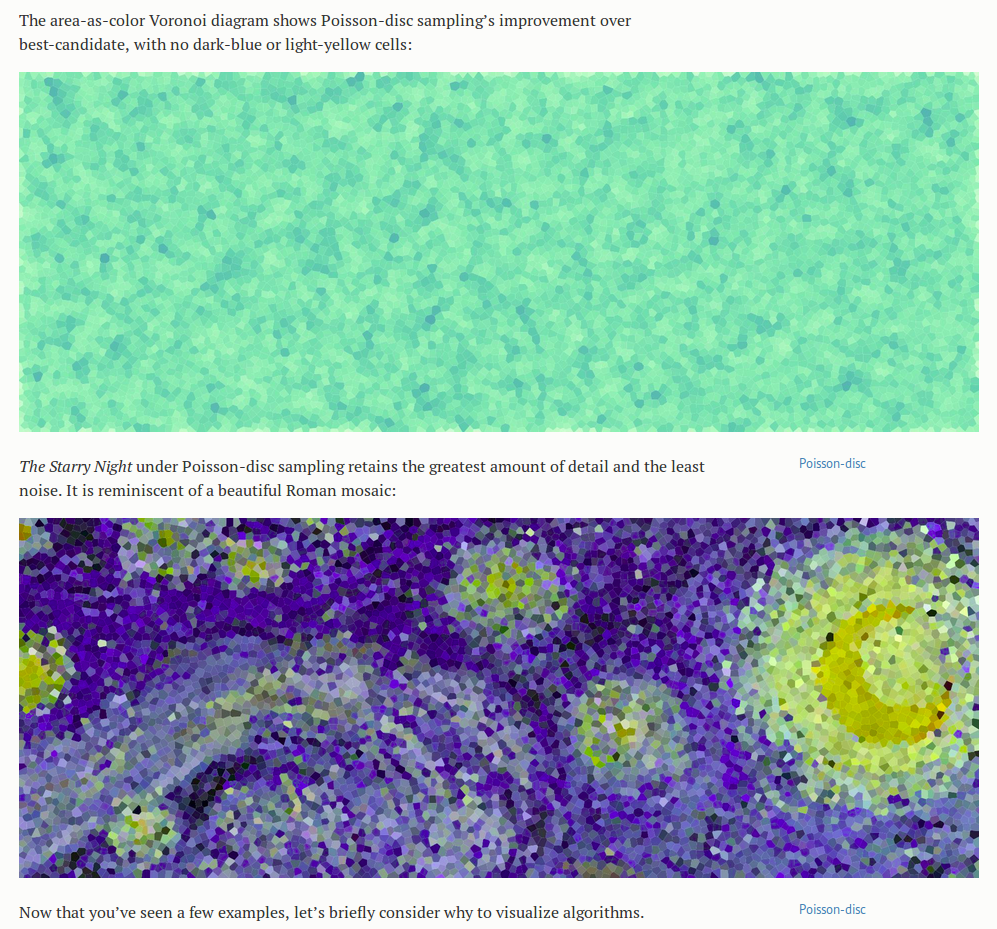
What thrills me more than the Starry Nights though, as an engineer interested in ways to make important details obvious, is the set of blue-green Voronoi diagrams below that compare the performance of the three algorithms. The cells in these diagrams are a lighter color when smaller and darker when larger, to accentuate the non-uniformities in size between cells- details already in the image, but that would otherwise have been much harder to see. It shortens the search our eyes have to make for those much larger or smaller cells. It immediately makes clear which of the algorithms creates the most uniform sampling.
…
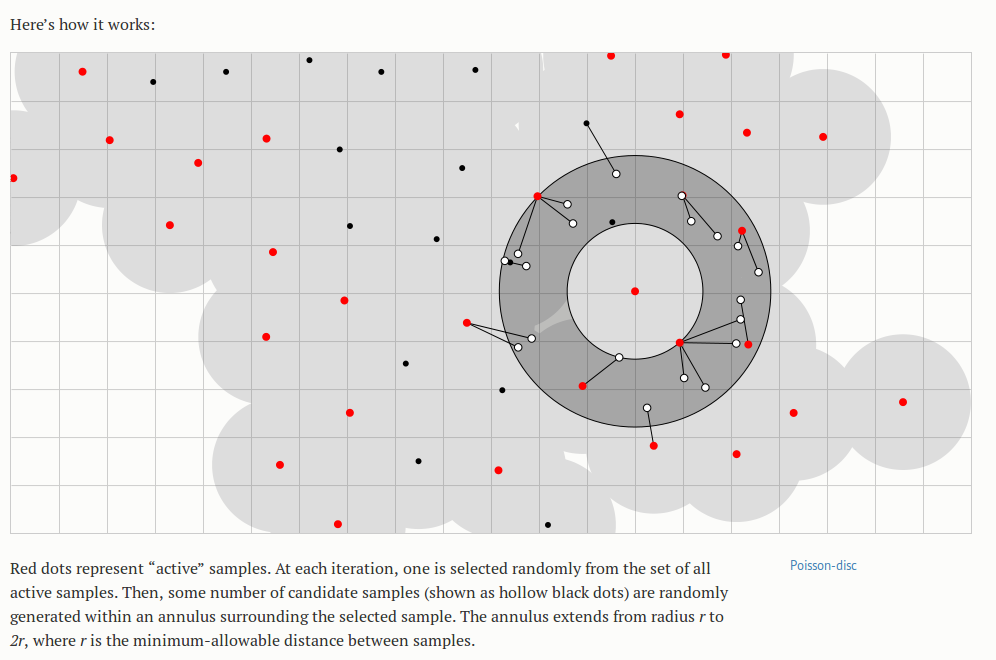
Of the animations in the essay, the Poisson disc is my favorite- not just because it is the best-performing algorithm, but because of its mesmerizing beauty. I stared at it for a long while before beginning to understand what it did, and the color cues were the most helpful at the start. I noticed that there were nodes that started out red and turned black, or “off,” and the process of discovering the algorithm amounted to answering the question “under what conditions does that happen?” It stimulated all the right questions, and then answered them. I also liked that the animation had processes noticeable at different time scales; I felt that the animation was a bit fast for me at first (without reading the accompanying text), and perhaps I latched onto the color change because it was occurring at a speed that allowed me to think in between changes. Being familiar with the algorithm now, all of the processes appear to be happening at a nice pace- but only because I know what to look for.
Finally, another note on relevance: the data that these algorithms generate are clean; there is little noise in the typical sense and relatively few confounding factors involved. However, the visuals help us realize the flaws and patterns that are there. The visibly inferior demonstrations of the completely random algorithm highlight the important fact that a “uniformly random” probability distribution does not lead to a uniform result, but also suggests the powerful role of the random number generator in creating any patterns that do appear in the set of generated points. Bostock later describes the role and idiosyncrasies of various random number generators, in the context of sorting algorithms, but I feel he could have done this earlier; or maybe the long foreshadowing was an intentional device to create more of an aha moment at the end for the learner.


