Harihar Subramanyam & Danielle Man
We examined a number of datasets about police, shooting crimes crime, and emergency services in Boston. We primarily used the Crime Incident Reports dataset, which indicates the type and location of crimes in Boston. We cleaned the .csv data, separating the latitude and longitude into separate columns, with Python scripts.
We have three questions:
- How is shooting crime distributed around Boston?
- Do the locations of the police stations and hospitals make sense given the crime distribution?
- How does police violence (especially towards minorities) in Boston compare to other countries?
Question 1: Crime Distribution
Let’s look at the shooting crime distribution over time and location.
Let’s plot the shooting crimes on the map.
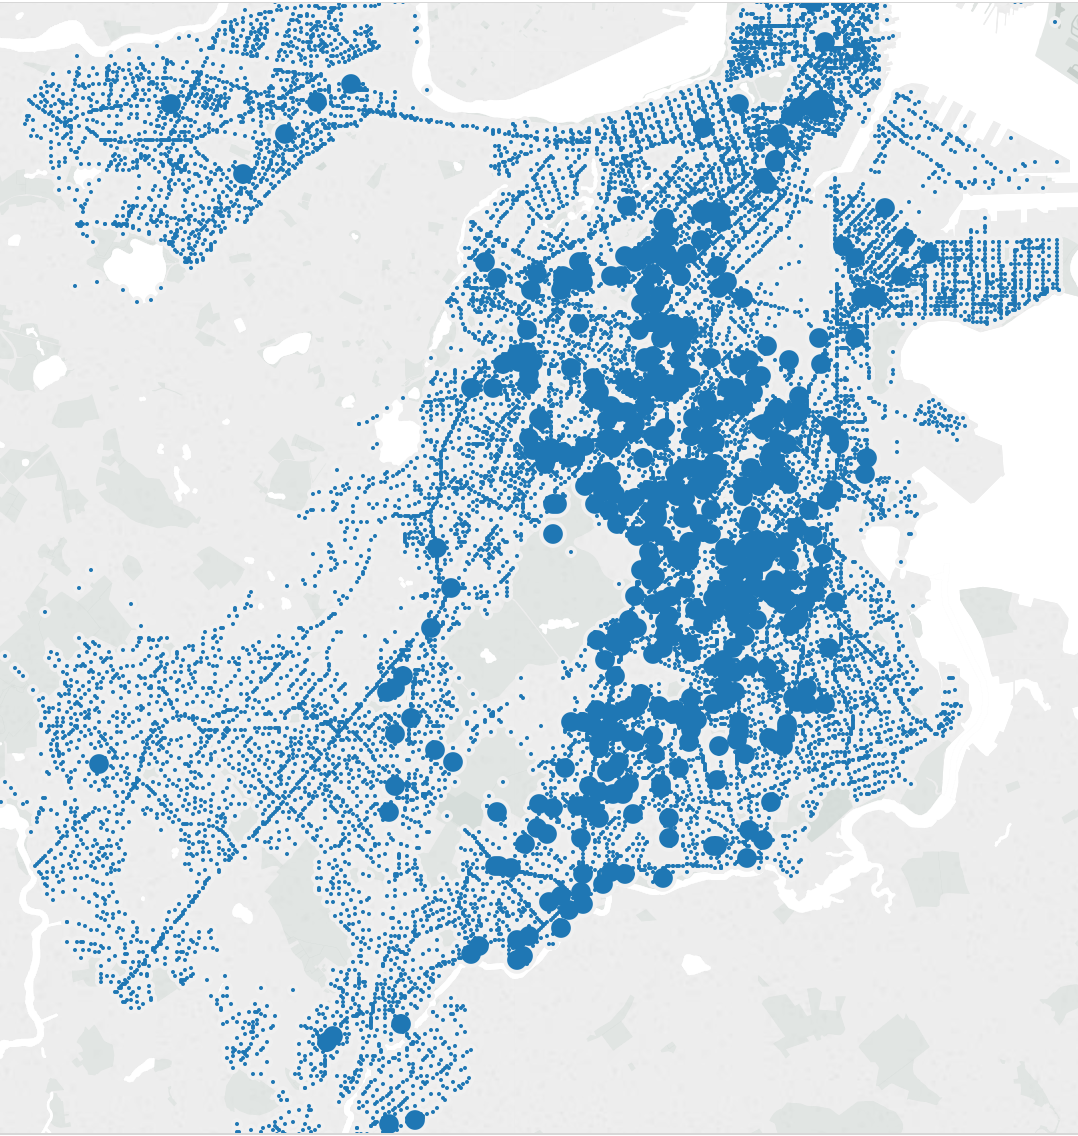
We notice that shooting crimes are not small in number and that they are clustered in central Boston. Now let’s map shooting crimes by year.
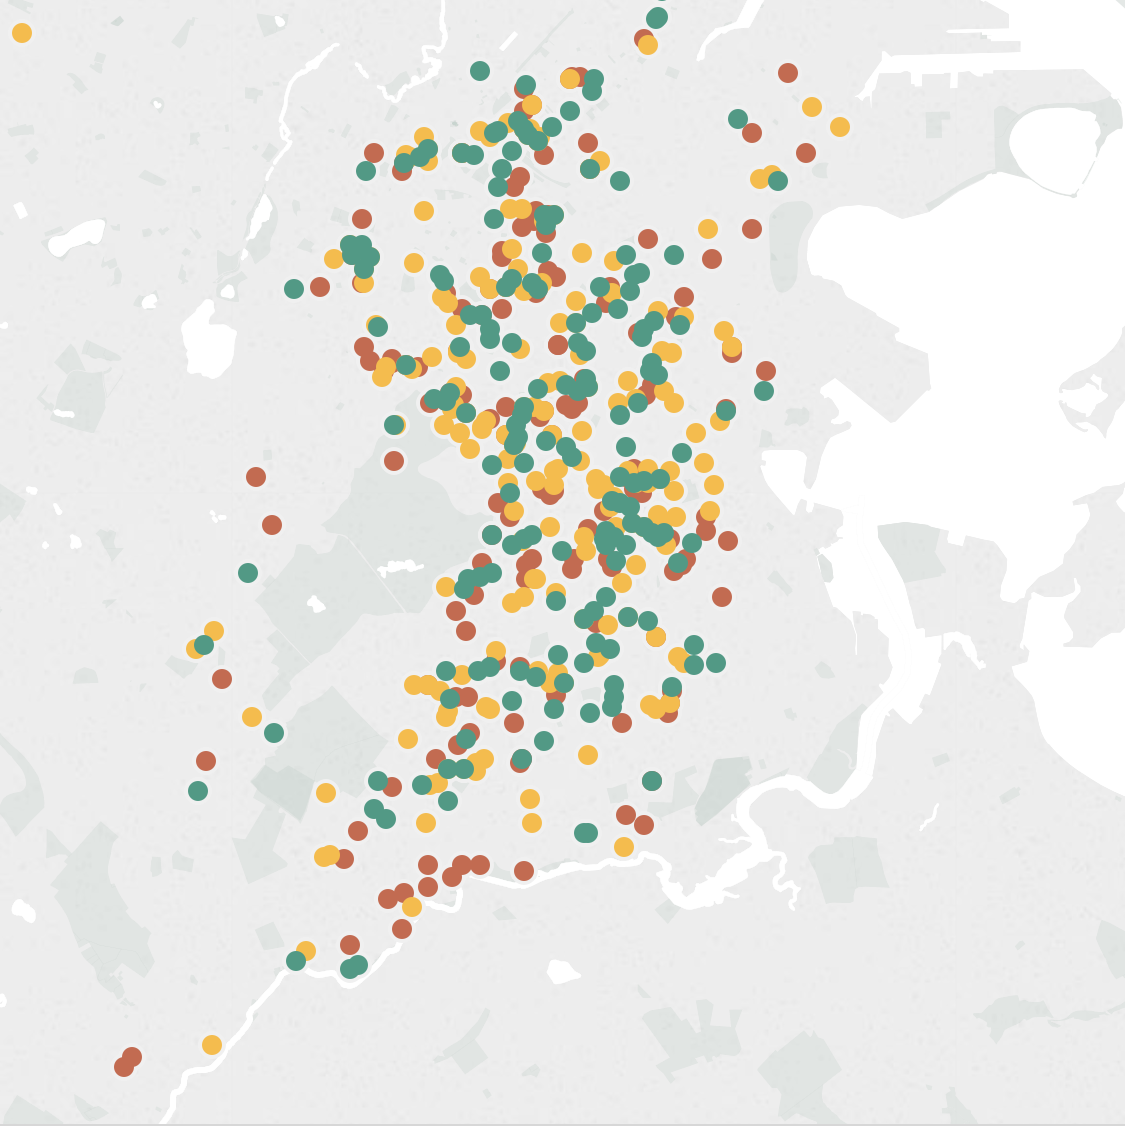
It appears that the distribution has not changed much year to year.
Question 2: Police Stations and Hospitals
Now that we know where the shooting crimes are, let’s see if police stations and hospitals are optimally positioned to respond to them. To answer this question, we need more datasets. The Boston Police District Station and Hospitals Locations datasets give the names and locations of the Boston police stations and hospitals, respectively.
The map below shows that the hospitals (red) and police stations (blue) form a ring around the cluster of shooting crimes and are within one mile of almost every shooting crime.
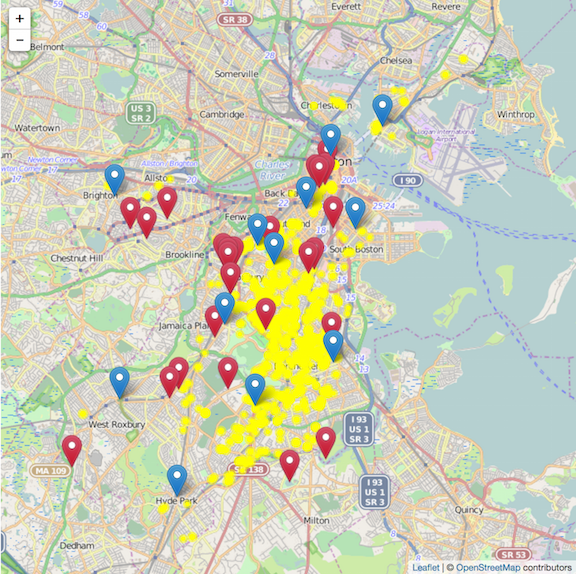
Hospitals are red and police stations are blue. They form a ring around the crime cluster. See the website here.
Question 3: Police Violence
Finally, given that police violence is a growing concern in the U.S., let’s look at how Boston compares to other cities. Again, we need more data, so let’s look at Fatal Encounters.

Killings by state. For the full visualizations see here.
We notice that Massachusetts does not stand out compared to other states. Looking at counties shows that Boston has fewer killings than almost all other large cities – see here.
Finally, we focus on Boston and look at the number of killings based on race, gender, and symptoms of mental illness.
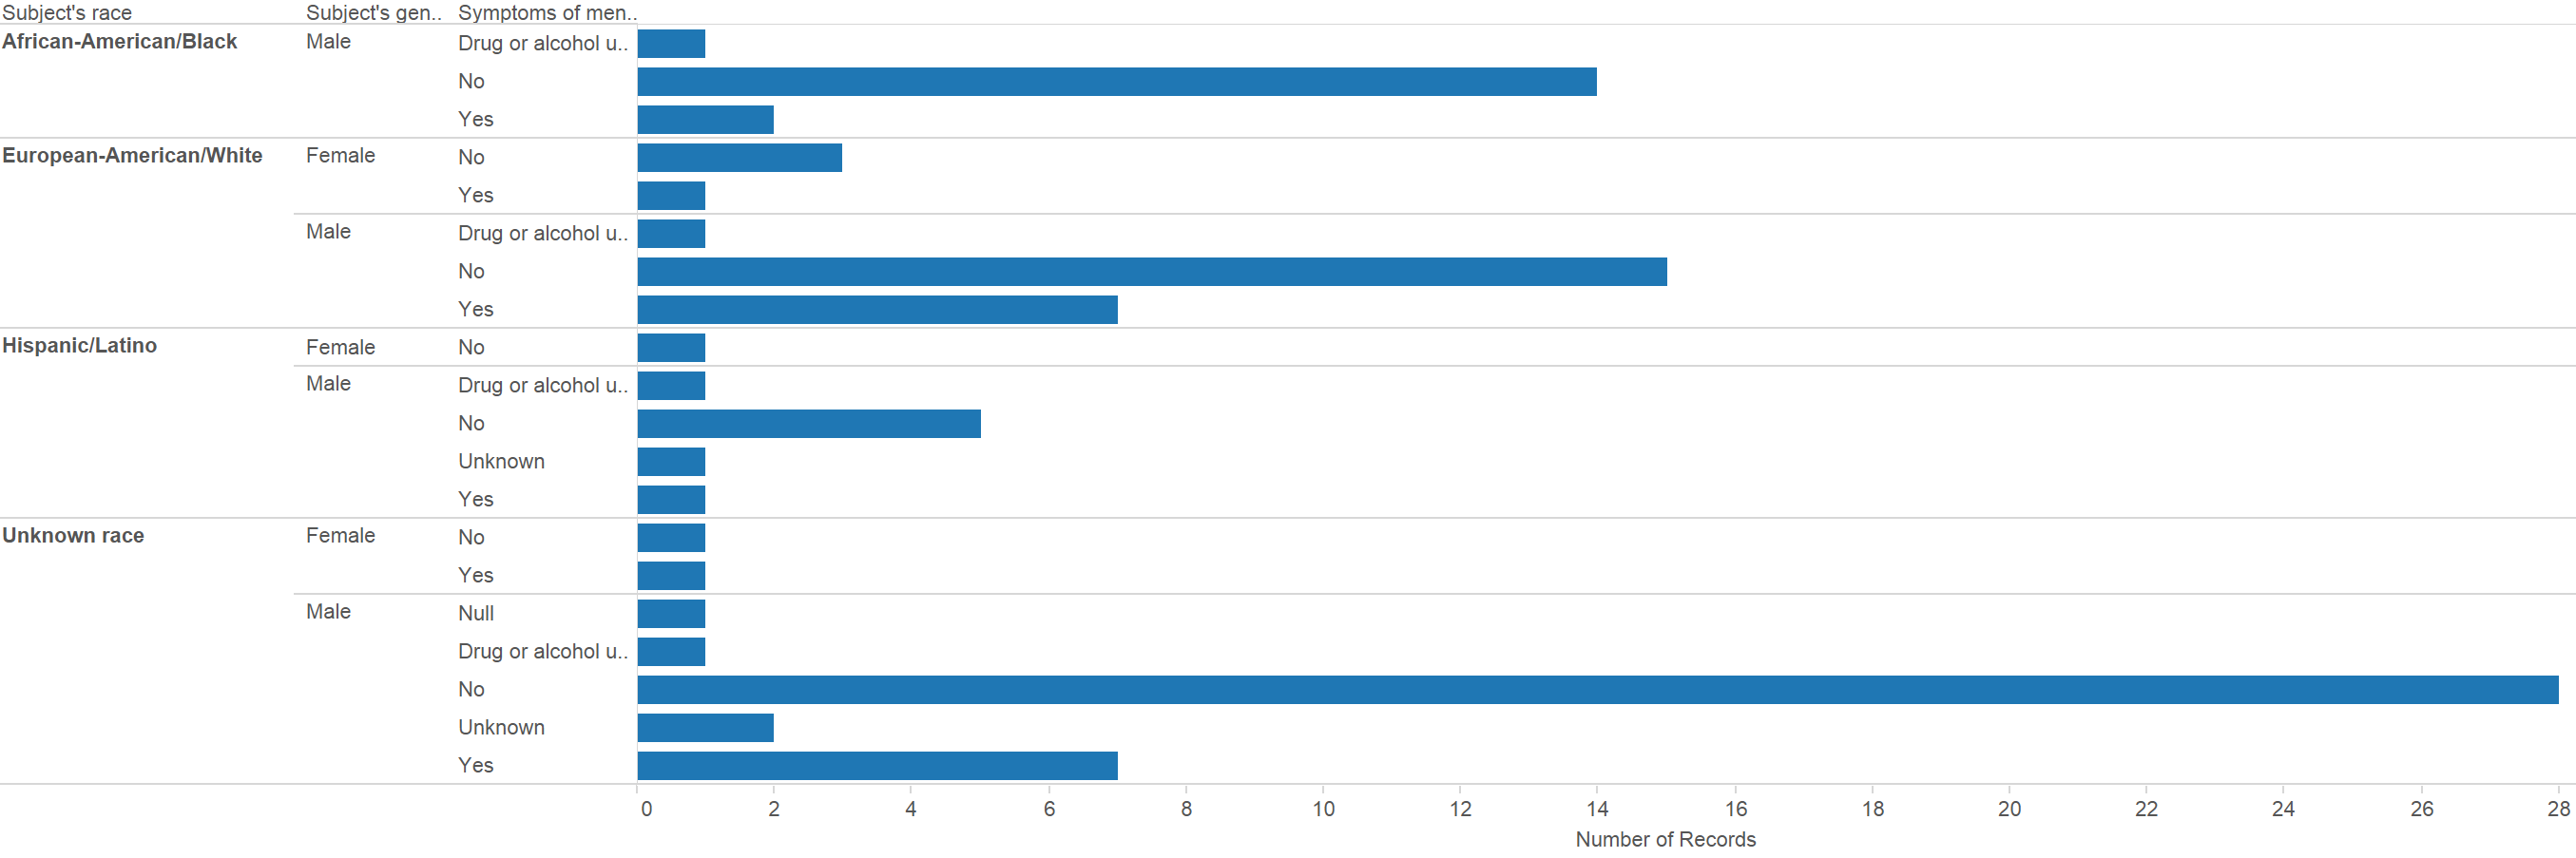
Notice that primarily men are killed, but that the distributions seem to be similar over the races.
Conclusion
We started with the crime incident dataset and combined it with other data (hospitals, police stations, and Fatal Encounters) to pose questions about crime distribution, police/hospital response, and police violence. With some visualizations, we explored the questions and discovered some interesting factoids. For example, hospitals and police stations form a ring around the cluster of crimes and police violence in Boston is not as extreme as in other cities.
Further exploration of these datasets, and perhaps other datasets, can help answer our questions.