Amy Yu & Ceri Riley
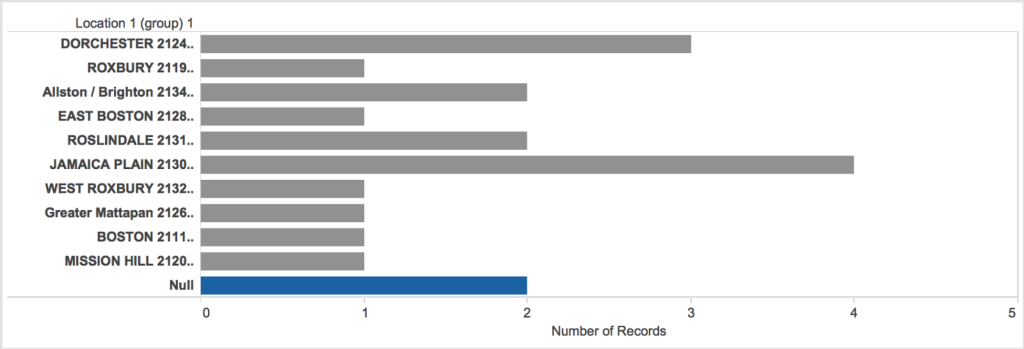
The primary dataset we looked at represents the locations of Children’s Feeding Programs in the Greater Boston area, ranging from after-school programs to those offered at community centers. According to the data (represented in this bar graph), there are only 19 total children’s feeding programs, many of which are concentrated in the Jamaica Plain region (4) and the Dorchester region (3).
From this dataset, we came up with three questions:
1) Does the availability of children’s feeding programs correlate with outcomes such as childhood obesity rates?
Because children’s feeding programs most likely do not have the budget or resources to distribute large amounts of healthy food, we wondered if there were any regional correlations between areas with more children’s feeding programs and outcomes related to child health.
For this question, we found a dataset based on a Google search – a .pdf report about The Status of Childhood Weight in Massachusetts, 2011. Because this report resulted from a BMI screening of public school students in Boston, we can correlate the overweight/obesity statistics from schools within a certain region with the presence of children’s feeding programs. In addition, we could directly look at the difference between body mass indexes of children in a public school with a feeding program, contrasted with those of children in a nearby public school without a feeding program.
2) How does the geographic distribution of feeding programs for children compare to the distribution of food insecure households? How does it correlate with household income?
Our original dataset is also a good starting point to investigate the class question of food security, so we decided to look for data on the economic stability and food security of the various regions in the Greater Boston area. We found these datasets by searching on Google and the Boston City Data Portal.
The Report on Hunger in Massachusetts is a .pdf generated by Project Bread in 2013 that presents Greater Boston-area incomes in relation to average food costs, both of which can be correlated with the locations of the children’s feeding programs. The Food Security in US Households .pdf report was released by the USDA in 2013 to present data on food security nationwide, and we can look specifically at the Massachusetts and possibly Boston statistics to find the most relevant data. The final two relevant datasets are a spreadsheet of Economic Characteristics by Neighborhood 2005-2009 and a .pdf of Boston in Context from 2007-2011, both showing the economic status of specific regions of Boston which correspond to some of the regions where there are children’s feeding programs.
3) How many children are these programs reaching? Is there missing data that should be considered?
We wondered whether these feeding programs are located in areas where there are many children, and/or if they especially targeted areas with children that might need extra care already, for example those that have working parents. By searching on Google and the City of Boston Data Portal, we found several relevant datasets.
To find out the number and distribution of children in the Greater Boston area, we found an excel spreadsheet with the 2010 Census Data for Boston and a corresponding .pdf report describing Boston By the Numbers, Children and where most children live (Jamaica Plain is 6th out of 10 regions and Dorchester is 1st with about 4 times the number of kids). In addition, we found an excel spreadsheet of the types and locations of Day Camps in Boston, where parents might drop off their kids with or without prepared meals, to compare with the feeding programs dataset. And we also found a excel spreadsheet of all the Boston Public Schools to see how the number and locations of feeding programs correspond to the number and locations of all the public schools.
