What is plotly?
Plotly is an online community that aims to make it easy to create, share, fork, and comment on one another’s plots.
What is it good for?
Plotly can be used at both the beginner and advanced level, offering multiple ways to interact with data and then present it.
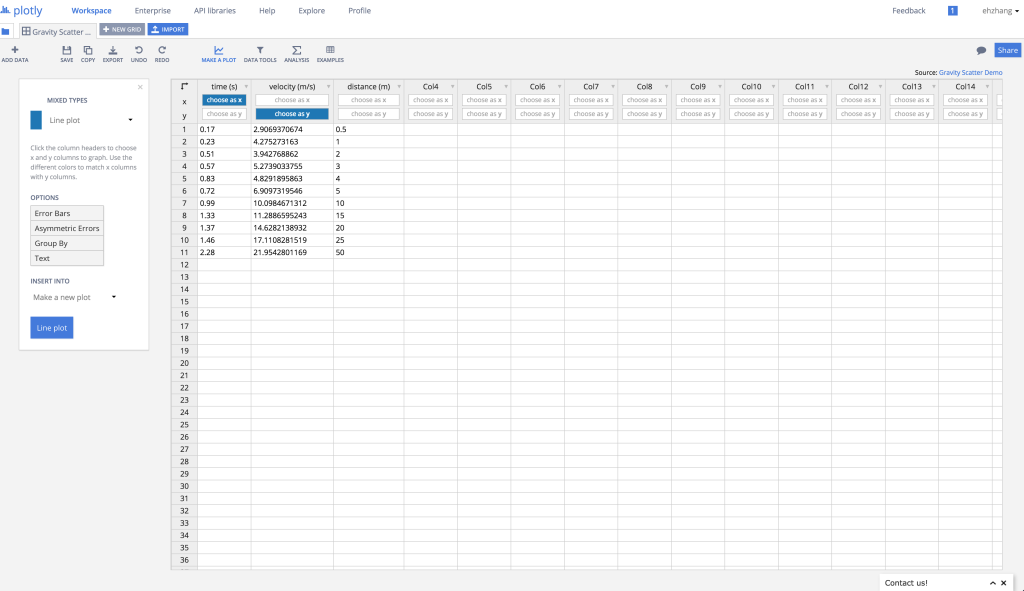
At the most basic level, it operates as a web application with a graphical interface for creating plots and stylization. Basic properties like fonts and colors can be easily manipulated, with other options to manipulate margins and padding if one wishes. With very little effort, one can use plotly to quickly create bar charts, line charts, heat maps, and bubble charts, to name a few. Some operations, like adding a line of best fit to a scatter plot, are also convenient with the push of a button.

More advanced users can make use of the API libraries, which allow the user to customize their graphs even further by using programming languages like python, matlab, R, node.js, or julia for more in-depth scientific graphing. Excel users can also get in on the action with an Excel plugin. Users can also have their graphs interface with hardware using Arduino, to allow for more interactive
As a data tool, plotly would work best in presenting data for presentations where stories can be told through traditional mediums, like line charts, scatter charts, or heat maps. For basic users without knowledge of programming languages, plotly offers basic charting and plots with the added flash of being easily shareable and interactive at a superficial level, with information available on hover. The community aspect is brought by an activity feed, which allows users to see other published graphs, and make comments or fork that graph and its data.
Basic usage aside, plotly’s hardware interfacing also offers the ability to tell stories that can be updated in real-time as a way of presenting dynamic data.
Getting started:
Plotly offers numerous tutorials on their website, mostly for some more basic chart types and how to create them, in both video and text format. A cursory Youtube search also reveals community-made tutorial videos on specific aspects of plotly, as well as simple introductions.
You can find a list the official tutorials, including videos, here: https://plot.ly/online-graphing/
API Documentation: https://plot.ly/api/
Hardware workshop tutorials: https://plot.ly/workshop/
Ease of Use/Necessary skills:
For basic operation, the web interface can be learned fairly quickly. Running through a tutorial or two will allow a user to quickly familiarize themselves with how to create some simple plots and change some simple properties to add custom styling.
For more advanced data manipulation, knowledge of a programming language may be extremely useful or even necessary. The web interface is mostly limited with static data that a user would import in manually, and does not have ways to easily execute very complex or custom operations on that data. With the API libraries, plots can be generated with a programming language.
Would you recommend this to a friend?
For basic graphs, I would recommend plotly to a friend. Plotly seems to excel in the creation of traditional graphs with the added flair of ease of sharing and interactivity on web. Even for those with programming experience, having an interactive and easily shareable graph that is viewable and publishable on the web is useful. With the documentation and code snippets in the API library documentation, using plotly would not be a very large hassle to learn and use.
However, for those already with programming experience, or those wishing to creating richer data visualizations that don’t involve traditional plots, I would not recommend plotly. It is also for this reason that I will not be considering plotly for my final data presentation.