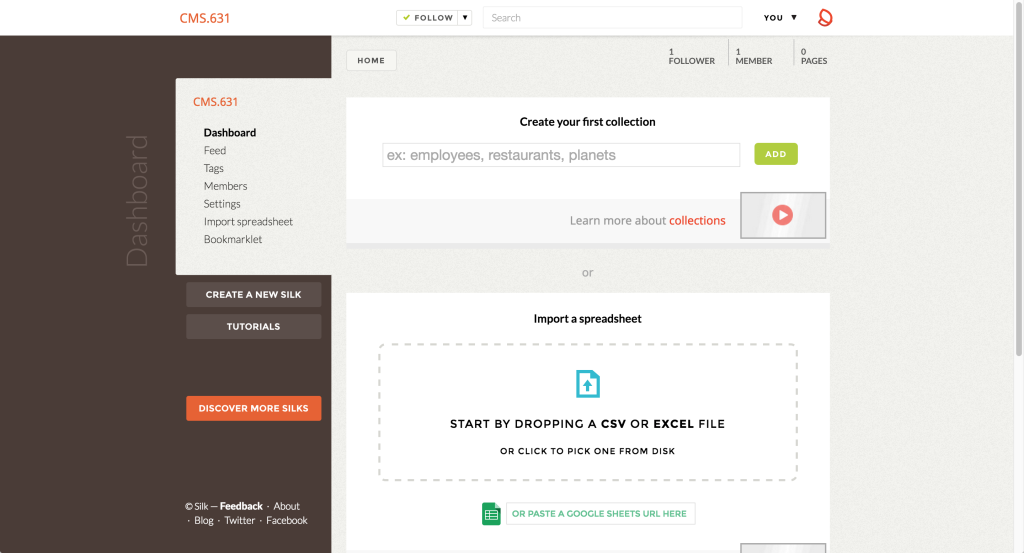
Silk, “a place to publish your data,” is an all-in-one dashboard for your datasets, letting you turn them into simple visualizations and webpages. It starts with the concept of collections (equivalent to spreadsheets, or tables in a database) — you can import data into these collections via CSV or Google Spreadsheets. A single Silk website can have multiple collections, so you can pull in data on related topics from various sources. Notably, Silk is not a tool for data cleaning; you must prep your datasets beforehand, including things like sanitization and naming/formatting. The final visualizations have some rudimentary filtering and exclusion tools, but they are not sufficient enough for major changes. Within the inverted pyramid of data journalism, Silk fits into the latter two sections: combine (figuring out how your collections fit together and what data from each is important) and communicate (actually designing and creating the presentation of that data).
While Silk requires no coding per se, it can be an intimidating tool just starting out due to the sheer number of features. For each item in a collection, Silk auto-generates a page for it with all the information filled in, along the lines of an Amazon product page or a website’s user profile page. These pages are searchable and filterable, giving you (as well as your users — for the free plan, all pages created are also public) a front-end to explore the records in your dataset. Moreover, you can add other team members to your Silk, turning it into a collaborative data library along the lines of the PANDA Project. To facilitate this collaboration, there is a feed page where you can see all the recent events/changes made by members of your Silk. It is interesting that the tool provides all this functionality even though there are few cleaning features (you can edit field names and make edits to individual records — that’s it).
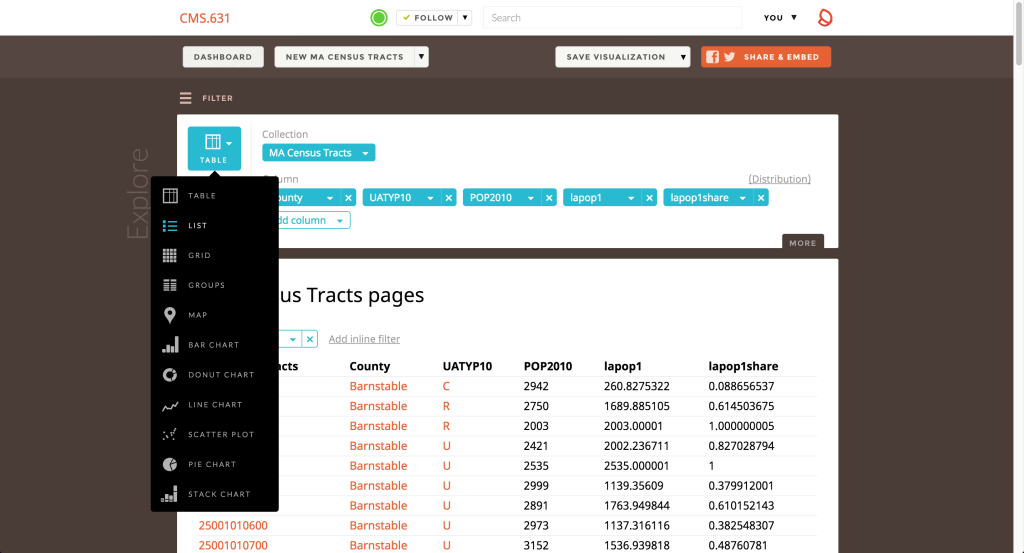
Once you’ve determined your data of interest, you can choose from a number of different visualization methods: tables, lists, grids (for datasets with images), groups (clustering based on a field), maps, and a number of charts. Depending on what presentation format you’ve chosen, Silk will try and auto-detect which columns might be relevant (e.g. geographic data for a map or numeric data for any of the charts) and plop that data in. You can do some fine-tuning in terms of what columns are displayed, how the data is sorted, and how many records to include. However, you cannot really customize the visual look and feel of the visualizations themselves — you can’t really do any sort of graphic design (e.g. color/size — everything is auto-generated) or creative variations on the defaults.
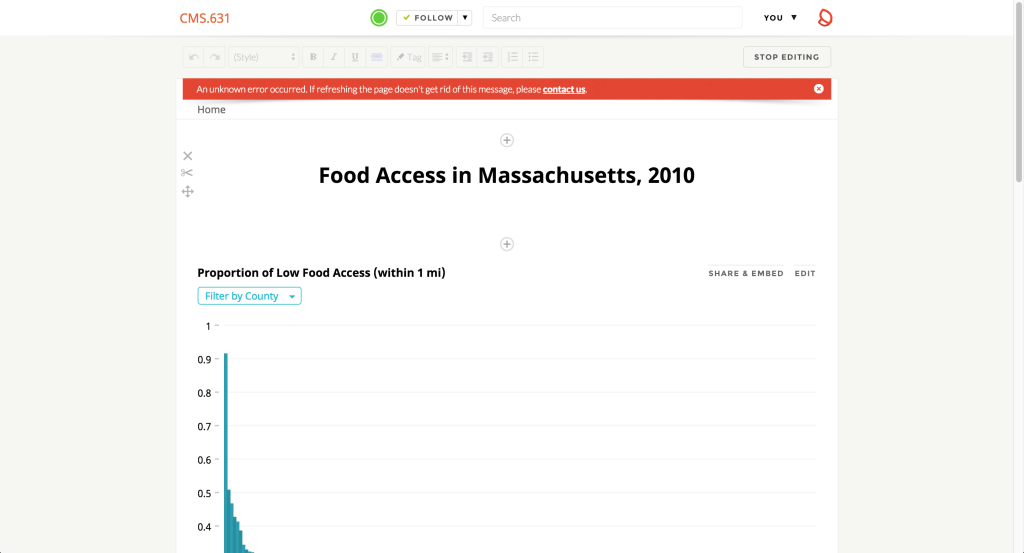
Once you’ve created all the visualizations you want, you can save them and add them to pages; these pages can be further populated with text or image content via a WYSIWYG editor, much like a blogging software or GUI-based web design applications. As such, you can create entire articles with the visualizations embedded/interspersed throughout — it’s especially nice that Silk links up everything automatically; for example, clicking a bar in the chart links to that specific item page, allowing readers to fully explore the dataset in that way.
Overall, if you can get over the initial intimidation of Silk’s huge feature set, it’s not terribly difficult to use, though some of the visualization-creation interface is quite non-intuitive. Thankfully, the Silk team has created a number of video tutorials and a FAQ section to guide you through the process. The two big gaps in Silk’s functionality are its lack of data cleaning functions and lack of customizability over visual presentation (within specific visualizations, not over the entire page). If you want a one-stop, out-of-the-box solution for managing multiple data sets and turning them into websites and those caveats don’t bother you, Silk might work.
As for myself, given that I do have code and design experience, I won’t be using Silk and wouldn’t recommend it to any friends who have opinions about those things. There are far better tools for data exploration and far better tools for data visualization; if you know enough about basic web development, you can just use those and put the results together yourself without the help of Silk.


