This article takes a data-driven approach to tell the story behind addressing the global challenge of sustainably feeding the growing world population. The presentation is geared toward both educating general audiences about the food challenges connected with population growth, and persuading policy makers to adopt certain strategies for mediating the global supply and demand for food.
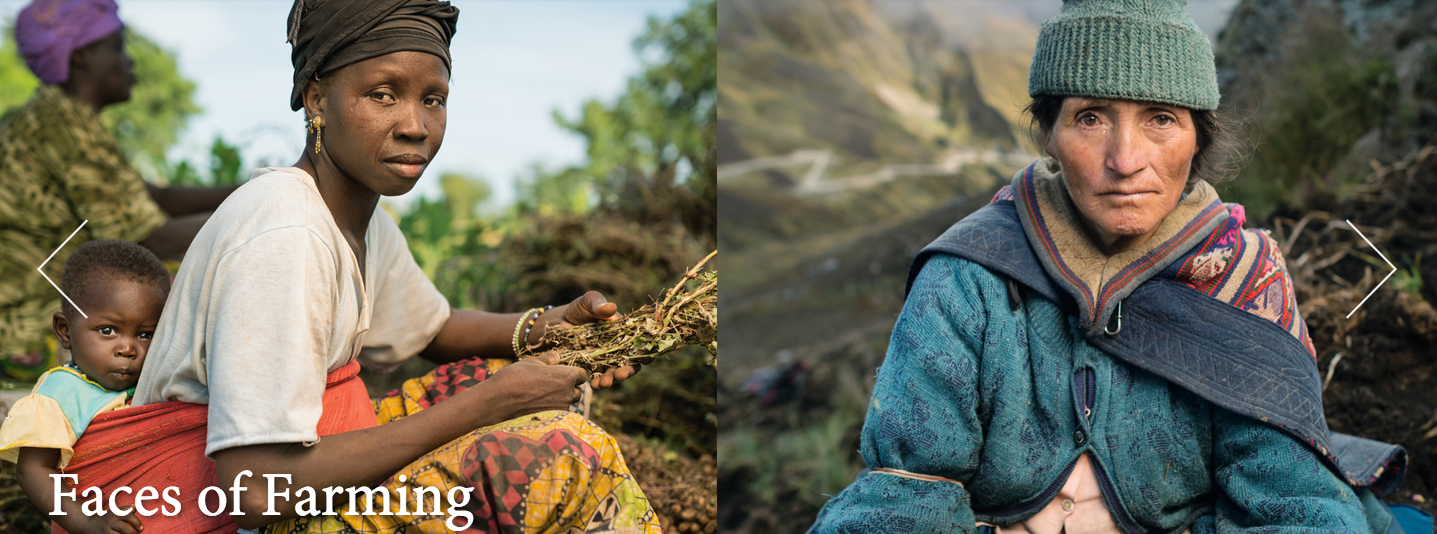
The data presentation uses both qualitative and quantitative data – using photos to document the diversity of food producers around the world and the impact of our agricultural footprint, and visualizations to convey key statistics that are central to the story – namely, mapping the global agricultural footprint and visualizing the projected need based on population growth.

In general, this data presentation uses a blend of techniques to effectively meet the goals of both educating a general audience, and conveying a set of high level strategies for policy makers to consider in the context of addressing this global food challenge. The use of interactive visualizations encourages the audience to explore the data, while the curated images and static charts depict very deliberate and specific data points that help to support the narrative of the article. The types of visuals are intuitive to interpret and do not require a high level of audience data literacy, and they can be taken both within the context of the article, or as standalone pieces. The structure and techniques employed within this data presentation are effective in empowering the audience to engage with the data presented while also reinforcing the key strategies proposed within the article.