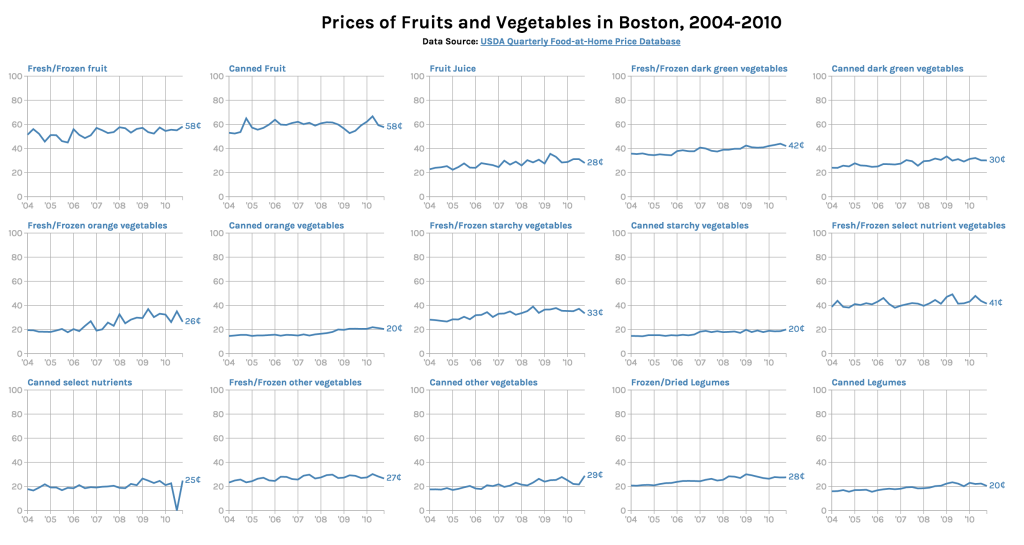
In this chart, we chose to explore the concept of small multiples — inspired by this Quartz chart of alcohol consumption around the globe, we wanted to compare the prices of different food groups over time. To accomplish this, we used the USDA’s Quarterly Food-at-Home Price Database, which measures how much each food group costs to Americans. We specifically focused on the Boston demographic (due to time constraints we were only able to process the data for the first subset — fruits and vegetables). Using csvkit we cleaned and extracted the data we needed, then visualized everything using the D3 charting library, though the graphs are not interactive at the moment.
The audience for this graphic is people in Boston who are the primary grocery shoppers in their households — we wanted to give a perspective on how food prices changed over the 2004-2010 period (there was an invalid data point that made it through on the “canned select nutrients” graph). We can see that the price of fruits and vegetables in Boston have been increasing gradually. There are a few areas for improvement: first of all, the graphs aren’t adjusted for inflation, so we don’t have the right context for the graphic. In retrospect, we probably should not have used the same axes for all the graphs since the per unit price is pretty different between them and it’s hard to see the actual change. Moreover, 100g is kind of an arbitrary amount and might not be an intuitive unit to think about food consumption in.
See the graphic in full size: http://s2tephen.github.io/qfahpd/
