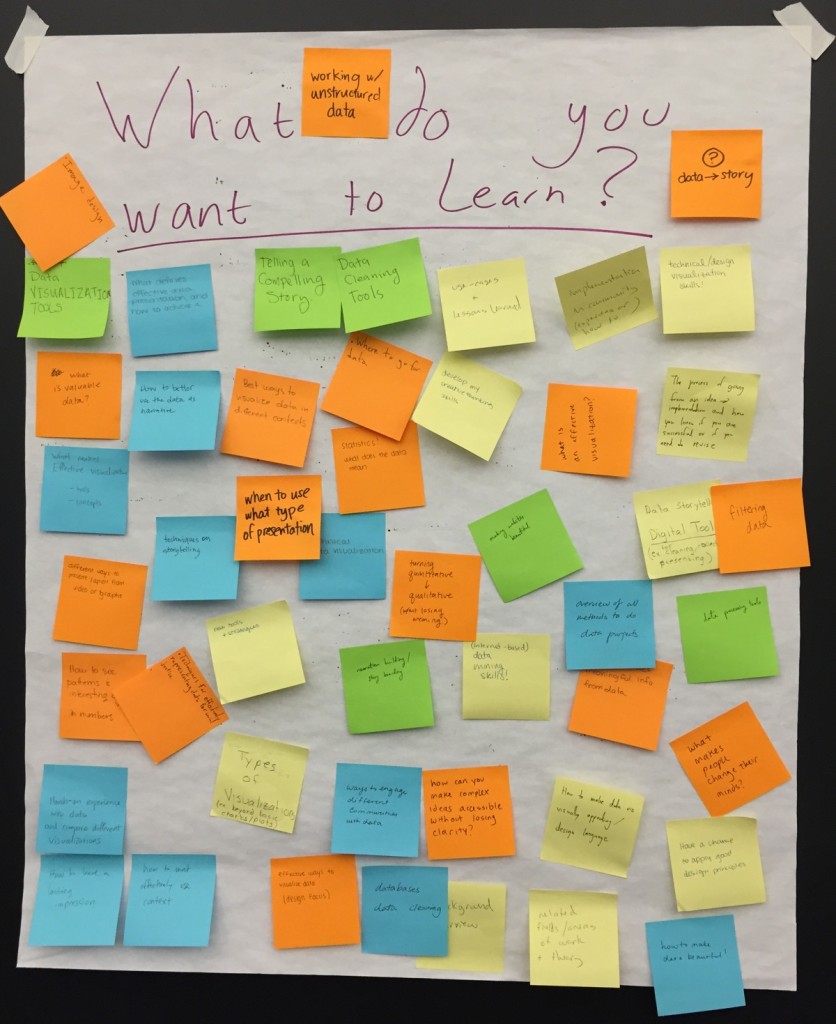
To help me focus the various modules, I asked everyone to write up some sticky notes indicating what they wanted to learn from this course. Certainly there is an aspect of “you don’t know what you don’t know”, but the exercise is still valuable for me. These goals line up very nicely with the syllabus I have planned!
Here is the typed-up list:
- working with unstructured data
- image design
- data -> story
- data visualization tools
- what defines effective data presentation and how to achieve it
- telling a compelling story
- data cleaning tools
- use-cases and lessons learning
- implementation in community (experience or) how to
- technical and design visualization skills
- what is valuable data?
- how to better use the data as a narrative
- best ways to visualize data in different contexts
- where to go for data
- develop me creative thinking skills
- what is an effective visualization?
- the process of going from an idea to implementation and how you know if you are successful or if you need to revise
- what makes effective visualization (tools / concepts)
- when to use what type of presentation
- statistics! what does the data mean
- data storytelling, digital tools ( for cleaning, collecting, presenting)
- filtering data
- different ways to present (apart from video or graphs)
- techniques on storytelling
- ethical data visualization
- turning quantitative -> qualitative (w/out losing meaning)
- making websites beautiful
- overview of all methods to do data projects
- data processing tools
- how to see patterns and interesting (?) in numbers
- techniques for effectively representing data for social justice
- new tools and strategies
- narration building / story boarding
- (internet-based) data mining skills!
- meaningful info from data
- what makes people change minds
- have a chance to apply good design principles
- how to make data beautiful!
- how to make data viz visually appealing / design language
- related fields / areas of work and theory
- how can you make complex ideas accessible without losing clarity
- background overview
- databases / data cleaning
- ways to engage different communities with data
- effective ways to visualize data (design focus)
- types of visualization (ex. beyond basic charts / plots)
- how to most effectively use context
- hands on experience with data and compare different visualizations
- how to leave a lasting impression
