RaphaelJS is a small JavaScript library used for work with vector graphics on the web.
This library can be used to create responsive and interactive animations and representations of data such as pie charts, maps, timelines, and many more. It is great for custom visualizations that allow for different types of user interaction (mousing over, clicking, etc), and offers great flexibility for implementing your ideas.
Because everything is rendered using SVG, browser compatibility is a big plus, which is pretty important depending on your target audience.
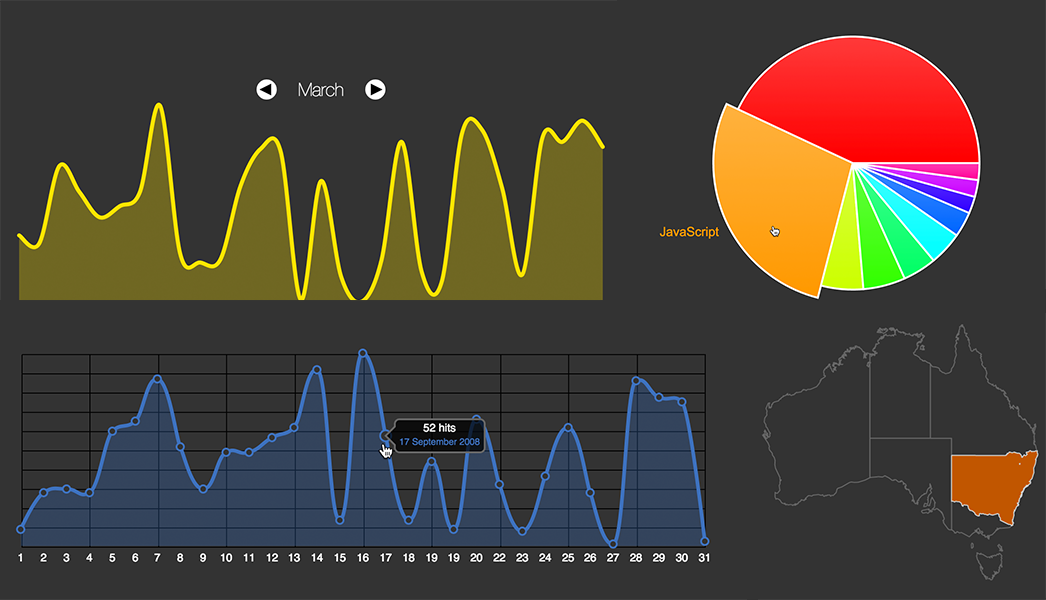
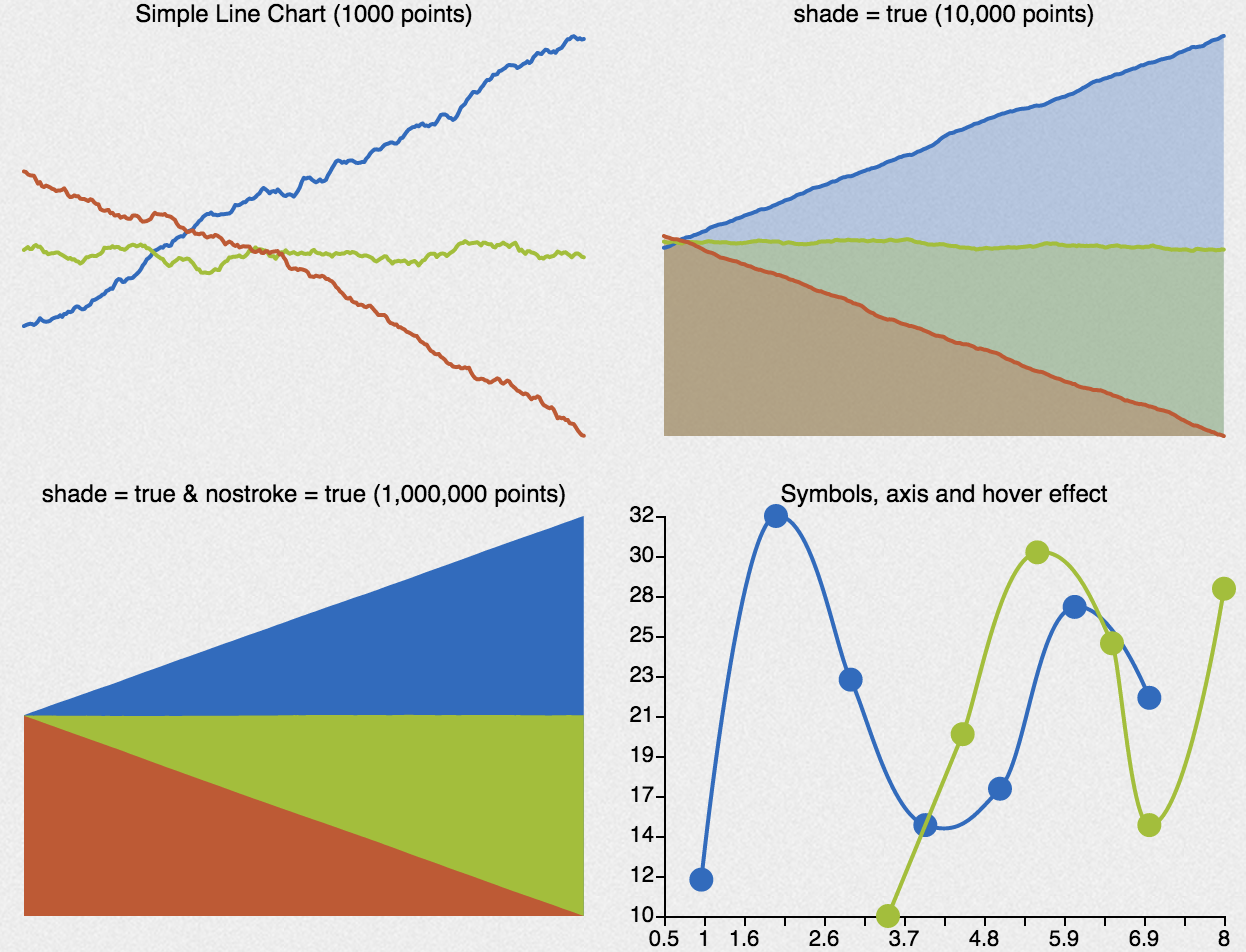
Raphael does not have a huge focus on datasets, however. Developers have built an extension to the library named gRaphael that allows for easy creation of charts, such as line charts, pie charts, etc, as shown in the following image.
How do you get started using it?
To get started, you can download the JavaScript file hosted on http://raphaeljs.com/, include it in your HTML page, and then start coding! Here’s an example taken from the site:
// Creates canvas 320 × 200 at 10, 50
var paper = Raphael(10, 50, 320, 200);

// Creates circle at x = 50, y = 40, with radius 10
var circle = paper.circle(50, 40, 10);
// Sets the fill attribute of the circle to red (#f00)
circle.attr("fill", "#f00");

// Sets the stroke attribute of the circle to white
circle.attr("stroke", "#fff");
The website also shows a few demos as shown in the picture above, and you can inspect the code used to create them by loading the page source for each demo.
A few tutorials:
– http://www.varunpant.com/posts/raphael-js-tutorial-part-i
– http://code.tutsplus.com/tutorials/an-introduction-to-the-raphael-js-library–net-7186
– http://www.lynda.com/HTML-tutorials/Real-world-example-Raphal-JavaScript-Library/80782/85035-4.html
How easy or hard is it? What skills do you need to become proficient in it?
Raphael is a bit more hands-on because it is so flexible. All you are given is a library of methods to use, and a few examples of how they are used to produce various visualizations. However, you will need to implement anything you want to show using javaScript. For that reason, knowledge or experience with coding, especially with using JavaScript in HTML5 websites, is necessary to become proficient with the library.
Running through a few tutorials will give you the basic familiarity needed to hit the ground running, but if you have little to no programming experience, you might have a bit more difficulty. The developers do provide documentation for the methods, as well as examples of the syntax, so while it shouldn’t be extremely difficult to pick up, the difficulty lies in putting the methods together to create what you want.
Would you recommend this to a friend?
Yes and no! If you a friend has an idea for a fairly complicated interactive (animations and custom charts, for example), or a clear design for what they want, but also has experience programming, then I would recommend it. However, if they don’t necessarily have the time or experience, I would recommend other WYSIWYG tools, which are much quicker to use, albeit with less flexibility.
Depending on what the friend is trying to do, I would strongly recommend using gRaphael in addition, to make it easier for working with datasets.
Will you consider using it for your final data story?
If i decide to make a web interactive, then I would likely consider it! It seems relatively simple to work with, and I’ve always been partial to creating things on my own to learn about different libraries. I also have experience working with javaScript libraries, so it wouldn’t take too long to familiarize myself with it.