Team Members:
Edwin Zhang
Danielle Man
Water Data Remix!
Our group was tasked with taking the original water usage data and providing a way to communicate it by making it interactive.
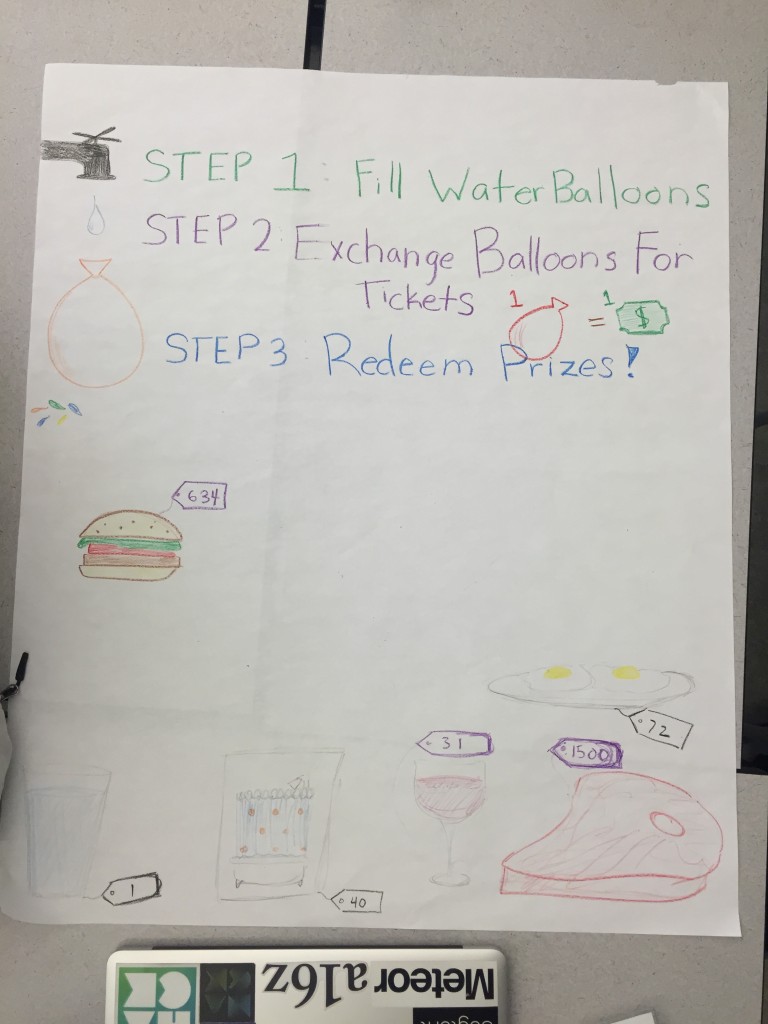
Looking at the data, we found that while some of the information involving direct water use was more obvious, the amount of water ‘virtually’ used for common products was the most surprising. In one example, an item like steak is illustrated as consuming 1500 ‘virtual’ gallons of water.
Though the virtual gallons of water are not directly used in say, feeding a cow that would later become steak, the the amount of water reported in the sheet is to envision the water used in processes that lead to the end product.
As a way to envision the amount of water involved in both the processes and the actual water used directly, we decided that it would be interesting to have an ‘exhibit.’ By filling up water balloons one at a time and exchanging them for tickets, a person could then exchange those tickets for various items. In doing so, a person could better understand the differences between the amount of water consumed for each item by engaging in an amount of work reflective of the water consumption.
