SNAP at the Grocery Store : Game Testing

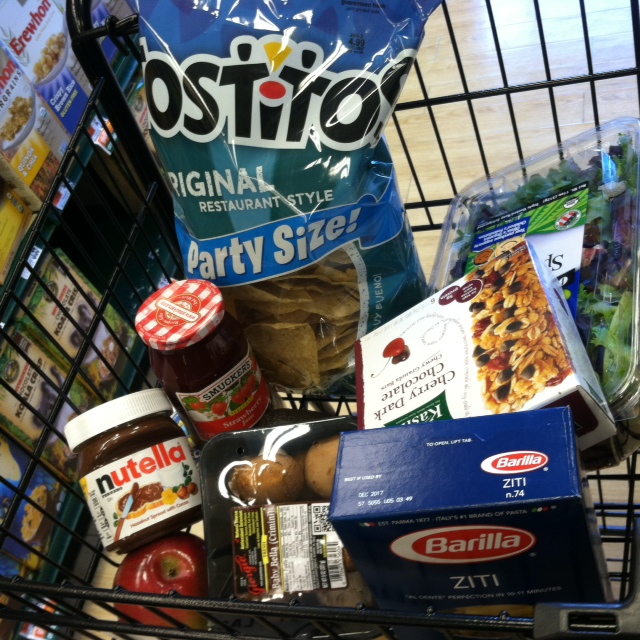
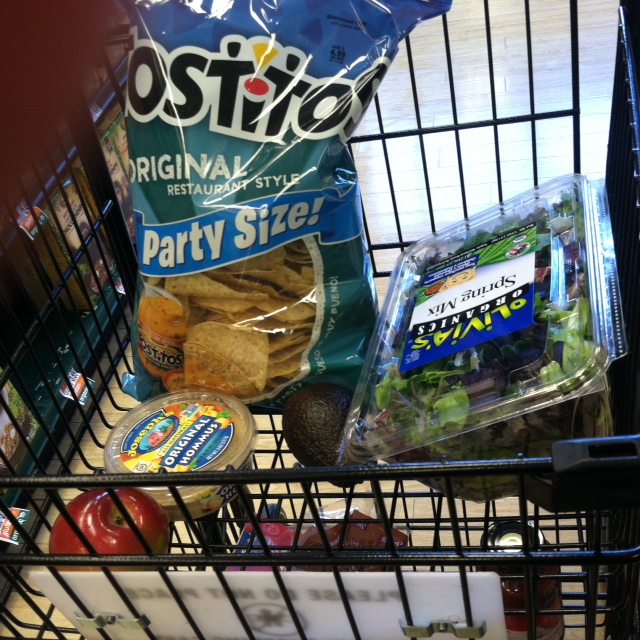
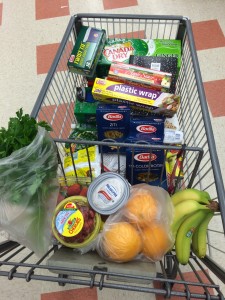
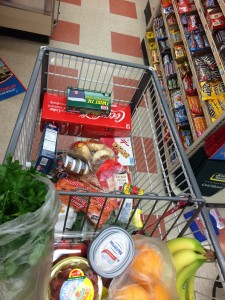
Our game takes place at a grocery store. We ask a participant to do their normal grocery shopping, and at the end, ask them to put items back until they reach the USDA Thrifty Food Plan budget. Our goal is to create empathy for SNAP recipients and the constraints they face while shopping for food.

After the participants finished choosing their items, we told them that 13% of people in Massachusetts used SNAP, that the USDA assumes you will spend 30% of your monthly income on food, and that SNAP is meant as a supplement to get you to the 30% number. We had a conversation around this information, and asked them:

How did it feel to put things back/how did you choose?
Do you think you could do this if you were on SNAP?

Overall, our game had mixed results. Here are some of the issues we encountered:

Participant “won” the game

One participant, who was shopping at Whole Foods for 2 weeks worth of food for himself, was very close to USDA Thrifty Food budget of $90 – he clocked in at $83. When challenged to get down to $60, he took out the wine (which he wouldn’t have been able to buy with SNAP anyway), some passion fruits, oatmeal and a few yogurts, which to him, did not represent a particularly large sacrifice. His reaction to removing these items, and the larger game was, “I feel neutral.” The participant, who works as a lab tech at MIT, is already on a tight budget and already considers himself budget savvy, so the fact that the came in under the SNAP budget was more an affirmation of his own budgeting skills.

Similar reaction was received by another participant who is an undergraduate in MIT and had a particularly tight budget for the coming week. In her reflection, she said “it was hard to focus on other people’s situations because I was already on a tight budget”. We realized our game made this participant (on a tight budget) focus on her own situations rather than the difficulties of people on SNAP. This took the focus away from feeling empathy for the SNAP recipients.

In the future, we should have a better debrief in the case that the participant doesn’t have to put a lot of items back. This also raises the question – how does this game make people who are on a tight budget, but not SNAP, feel? It needs to be super clear that the participant should focus on the SNAP recipient’s difficulties, rather than compare their own situation – it’s about putting themselves in different shoes.


Game took too long to run

Participants also commented that the game took a long time to run (tallying up the cart, debrief) – they felt that it slowed down the shopping process considerably. For example, participants were concerned about frozen food melting during the debrief. In general, participants might not have time after finding all their groceries to participate in this game, so we should try to speed up the process as much as possible.

We also noticed that it was a pain to follow someone around and log everything they put in their cart (“Wait, what did you just put in?”). For example, one participant doesn’t typically weigh his produce, but we asked him to for our game.

Shaw's - Before
Shaw’s – Before
Shaw’s After

Participants don’t do all their shopping in one place

Another participant (Male, 45 shopping for 3) has habits in terms of grocery shopping. Splitting his budget in different locations like Costco (for the bulk and longer term products) and Market Basket (cheap fresh produce and smaller quantities). This makes it harder to assess what amount of money they should be aiming to meet for the game.


Market Basket – Before
Market Basket – After

 
Other notes

We realized this game doesn’t take into account whether someone eats out or not during the week. One participant came in under the SNAP budget, but would have easily gone over if we counted what they spent eating out during the week. To make the game more realistic, we’d want to subtract the amount spent eating out from the SNAP budget at the grocery store.

Costco

COWBIRD, a public library of human experience

cowbird

WHAT?
Cowbird claims in its “about” section that it is a multimedia storytelling tool.
It is a free tool and gathers a library of human experience under a simple set of storytelling tools. What they mean by tool is a combination of pictures, text, and sound to create a beautiful record of your human experience.

The idea originated from Jonathan Harris, an artist and a computer scientist. I have known the artist from this great project called The Whale Hunt.
It started in his former project called Today, as a ritual of taking a picture a day, writing a short story and posting it online before bed. From that initial project, it took Harris and a small team 2 years to build up what now has become a real library of human stories. From a personal project Cowbird has become a small company.

WHAT FOR?
So, Cowbird is a platform where you can go to tell a story that you think is worth sharing with a wider community of lovers of good stories. Good but also deep and at personal level.

The idea is for people to tell short location-tagged stories based on their own experience using text, photos and sound or a mix thereof.
The more personal and authentic your story, the more it will resonate with the still relatively small Cowbird community. They claim on the website as of today March 30th 2015: 43,654 authors from 183 countries have told 79,493 stories on 27,721 topics.

Harris claims to Cowbird have 3 objectives
+ Create a space for a deeper, longer-lasting kind of self-expression than you’re likely to find anywhere else on the Web.
+ Pioneer a new form of participatory journalism, grounded in the simple human stories behind major news events.
+ Build a public library of human experience — a kind of Wikipedia for life experience.

Capture d’écran 2015-03-30 à 15.19.14

HOW TO GET STARTED?
Well there are, I think, two types of users who can experience Cowbird.
You will have the active participant or the passive one. Being a witness for life as the tagline says. The active participant will be the one who created an account and share some information about himself/herself and start to share the kind of stories they want to tell or curate. The active user will bethe one documenting with his personal stories.

As for the passive participant, he is the one who will browse and discover, experience the perspectives through the different possible paths: search, stories, seeds, topics, places, dates, etc.

Capture d’écran 2015-03-30 à 15.21.31

cowbird1

HOW EASY?
Cowbird provides « a warm and welcoming environment » for storytelling, which is home to a global community of storytellers.
No particular skill needed to use it. I just created an account and confirmed my email. The website is beautifully designed and provides its community of users with typography, infographics and the possibility to upload photos.

The difficult part for an ‘active’ user would be the approach and the commitment. What approach to have? Finding some kind of balance between the personal and journalist challenge. It is a editorial question. How do you curate your story?
Cowbird takes time and invite people to reflect on themselves. Cowbird is “more of you than dashing off tweets from a cell phone, but we think it gives back a lot more, too” said Harris.

Capture d’écran 2015-03-30 à 17.09.23

WOULD I RECOMMEND IT?
Of course. As a passive participants first. Browse and discover the stories, is an easy and simple way to get inspiration.

WOULD I USE IT?
Yes, if I like to tell stories and share them in another platform than a blog for instance.

USAGE
I think for journalists to be, it is a great platform to help improve and connect with an authentic audience. Through the most viewed, or loved sections you can see your story becoming popular.

Personally, hearing the stories with audio with the photo is more compelling and helps to better understand the translation of the experience.

I am not sure if I would use Cowbird in my final project, but definitely to get stories and inspiration as I would consider Cowbird more like a library.

From Data to Story : on our way to Food For Free Mural.

Our project for FOOD FOR FREE started with identifying a possible story based of the dataset provided by the association.
Not only the data was backed up by a short presentation by their director, which gave a helpful insight and personal experience as well as stressing out some key elements of their story.

As stated in the Segel & Heer reading, traditional narrative visualizations are usually based out of the data itself. The data reveals the story. In our case it was slightly different, as it was great to get an insider perspective and the director’s testimonial as a start.

How to turn the dataset into a story? Our methodology was a mix of different techniques and broken down into different steps. First, we found different storylines and then identified keywords, and from keywords then created mind maps that circled those latter.

The Director’s speech gave us some hints for our storylines: some focus on the City of Cambridge, the results of their labor, the impact of the association on the food served, the increase of produced food, etc.
We translated data into one or three sentences for most and then merged it into one paragraph. Our word webs became rough drawings, and we got our mural skeleton : a tree-like with trucks making connections between buildings as donors and people as recipients.

The story we came up with is simple as we are doing a mural, limited interaction and minimum messaging. And we didn’t not use the common comparative techniques as mentioned in the Data Journalism handbook eg as proportion example, internal or external comparison or change or over time.

The goal of our visualization is to “engage with reader in finding and telling their own stories in the data”. So the story we came up for FFF is not only reader-driver or author-driven it stays in the middle of this spectrum. Our messaging is clear, engage with the reader. However there is no direct interactivity unless there is a “call to action” in our mural something like a “contact us” for instance.

Tuyen’s 24hours data activity log

I was in New York last weekend so this relates the trip back home that shows a more data generated activity than a regular quiet weekend.

Sunday Feb 8

11:00 woke up in the hotel room no alarm clock

11:00 checked texts on my iphone to see if friends responded to my texts about D’angelo concert feedback.

11:30 took a shower, used water from the hotel

12:00 check out of the hotel room and use the hotel computer

12:05 booked some tickets for a Broadway show via credit card, on the hotel computer received confirmation email.

12:15 booked a table via Opentable for 2 for lunch (but never went)

12:45 went to a random Japanese restaurant instead

13:15 checked facebook and online reviews on last night concert

14:00 restaurant paid by credit card and got printed receipt.

14:30 walked on Times Square and took some pictures – my iphone tags the location of the picture

14:33 a camera on times square took my picture and shows on a gigantic marketing board for Revlon

14:40 arrived at the theater and pick up tickets at registration, barcode tickets were scanned.

15:00 show starts.

16:00 intermission, bought drinks with my credit card

17:30 going back to the hotel by subway, paid $10 metro card refill by credit card at the subway station

18:34 took the train at central park to West Haven. Tickets were bought the day before via credit card and were checked manually byan agent

18:40 listened to music on the train with Spotify on my phone

19:25 received text from MassArt closed on Monday

20:15 arrived at West Haven and picked up the car – security cameras in the train station.

20:20 used Google maps app for directions to Home

20:30 received email from MIT alert. School closed

21:00 collected a ticket for the toll

22:30 filled up the car with gas on Mobil station with the Speedpass – will get the bill at the end of the month

22:45 ordered some food and paid credit card

23:30 paid the toll $2.75 in cash – probably security cameras

00:00 arrived home safe, brush teeth- data will be reflected on water bill, city of Arlington

00:15 put the heater in the room – will be reflected on electricity bill

00:30 turned on Netflix to watch a movie, I searched by category foreign movies – and felt asleep.


Monday Feb, 9

08:30 woke up naturally– no alarm.

08:45 brushed my teeth and bathroom use- reflected on water bill, city of arlington

09:02 received texts on my phone, date and time tagged checked facebook, instagram

09:18 put the Netflix movie back- right where I stopped it the day before

09:30 replying to emails- connecting to home network (Xfinity)

09:33 received email from Opentable saying “Sorry we missed you at the restaurant”

10:00 weight myself – records the weight on the digital scale

10:17 received email from my bank asking why I transferred huge amount of money on Dec 8 and Jan 21

10:21 looked at my bank account HBSC App on my phone, bank tags last time I logged in.

10:34 opened a new word document, saved it several times on my laptop

10:45 downloaded the Txto app on my mac – browsed all your texts ready for printing.

11:00 watched French TV show on canalplus.com with login and password

Couples Text Messages are Decoded

In a recent newsletter article sent by the Parisian website Merci Alfred, Les SMS des couples déchiffrés (can be translated by Couples Text Messages are Decoded) shows within a few infographics how texts as part of the couple new language. It gives stats and possible trends on couples texting behaviors in a humorous way. Over 100 millions text messages of couples have been analyzed with the help of Tx.to a website that allows you to print your SMS conversations.

The figures are split in Gender behaviors and questions asked are : % of sent texts according to the status of the relationship, the day of the week, length of sent texts, most frequently used words in texts, most used emojis, first ” I love you” and “make love” are said, time of response between texts, etc.

The goal of the data presentation seems to show that you will have a different behavior in your relationship according to your gender. Even though they claim a study with over 100 millions texts, the audience understands that the point is not to run a scientific study but rather show stats in a funny way. As each graph is almost always annotated to highlight that difference. For instance, when we see the time of response between texts of 2:30min for Women VS 4:30min for Men the annotation says : c‘est parce qu’on s’applique ( it is because we try harder)

The data presentation is effective because it distinguishes Gender with a different color code and show simple binear comparisons with only a limited figures per graph. Males and Females behave differently. We all know that.

Those who saw the article are the recipients of a newsletter that targets urban males living in Paris city. But it is also shown on their website. So it really aims at not a specific male audience but mostly an urban audience,  fairly young 18-35yo.