Playtesting Food Sec Sim: “It’s Like the Game of Life, But With Food”

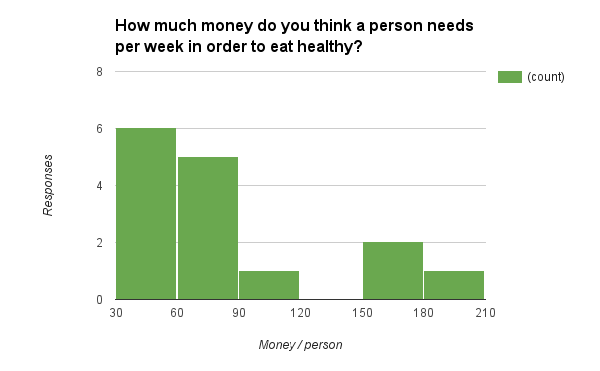
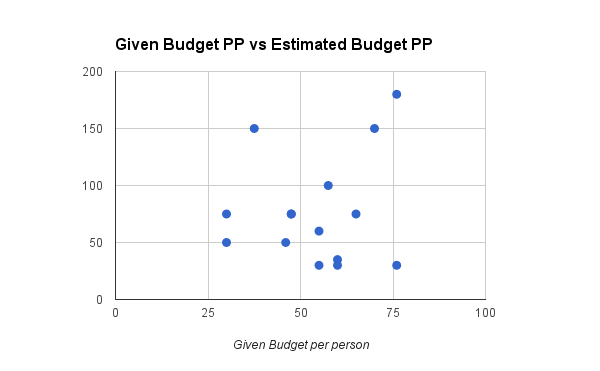
In playtesting our game, we asked participants to budget their food expenditures before and after to see how their perspectives changed, as specified in our original design. Additionally, we asked the playtesters two questions to tie the game back to the real world:

  • What are some challenges that people facing food insecurity have to deal with?
  • What can we do — whether it’s as individuals or as a broader community/society/nation — to help with those challenges?

During this process, we saw the game was successful in getting people to think and talk about food security as an issue but the gameplay needs to be fleshed out significantly to better achieve its goals (i.e. building empathy). The overall design worked — among three playtesters, two under-budgeted on food by only using the SNAP money and ended up allocating more money to food at the end of the game. The third playtester didn’t change her budget (though she was already allocating more than the SNAP amount) because she thought it was livable. “I’ll just have to do it in real life,” she said, perhaps hinting that the game wasn’t effective in representing the challenge of subsisting on so little money per day.

The random events were pretty effective in illustrating some of the challenges faced by people on SNAP (though the “positive” events didn’t really do much). One playtester got injured and couldn’t work for a week, losing 1/4 of her income; as a result, she ended up losing too much money and couldn’t pay the amount originally allocated for food. Housing turned out to be far too expensive (since the dataset used was based on average rent prices, not the rents that SNAP participants are probably paying), so participants chose either to live in public housing/a homeless shelter or crammed their entire family into a one bedroom unit.

The responses to the post questions showed an increase in awareness (but not necessarily empathy — we might need to come up with a better metric to measure this) of the conditions surrounding food insecurity. One playtester noted that living on such a tight budget “would require a lot of planning, and if you’re on food stamps, you might not have the time to do that.” Another acknowledged the volatility of poverty: “The biggest challenge is emergencies — if someone gets injured or they don’t have a good health plan, they might have to take out a loan.” In terms of potential action items, playtesters proposed producing suggestions for food purchases with nutritional value (ironic, given that this is the methodology for actually figuring out SNAP benefits), organizing communal trips to the grocery store, and holding community meetings around the issue.

From an actual gameplay perspective, there needs to be more player agency and choice. One playtester said the game is “like one of those BuzzFeed quizzes — it’s like this, this, or this, and then here you go, the end — with the little description.” One way to solve this would be to add more detailed character biographies to increase the sense of role-playing, immersing players deeper in the experience and raising the stakes on an empathetic level. Another approach would be to change the granularity of the game — rather than running the game week by week, we could have it operate per day, with more decisions (meals, whether to go to the grocery store, etc).

Another issue was that — even though the game was designed as a multiplayer experience — there was little to no interaction between the players. Certainly, having multiple people made the conversations more fruitful, but actually having gameplay interactions between them would have probably made it more interesting. Finally, to address the issue raised by our second post-question, we could introduce other characters/events to the game perhaps to illustrate ways in which we can help the food insecure (e.g. maybe you could go to a food pantry/bank as a “lifeline”). This would give playtesters tangible action items to take away from the game.

SNAPSim: Game Testing

Our game was hosted at http://ehzhang.me/snap-sim. Game testers were given a random family size and weekly food budget, and were told to select food items within their budget that would allow them to eat healthy.

snapsim


After playing, they were directed to a google form that recorded their food budget, family size, resulting score, and the amount of money they had leftover. They were also asked to answer the following questions:

  • Did your score surprise you? If so, why?
  • Did you have to make any sacrifices (ex. not getting a food you wanted) because of your budget?
  • How much money do you think a person needs per week in order to eat healthy?

Feedback

Average given family size: 3.5

Average given food budget: $185

Average final score: 48.98

Average money leftover:  $59.97

Many people found that our game was fairly easy, though people who ended up with bigger families and smaller budgets tended to find the game more difficult. There were many testers who were surprised at their final score at the end, since they purchased food they would normally eat.

Responses to how much money a person needs per week were across the board, though more people tended to think that less was best.

The estimates didn’t seem particularly correlated with their given family sizes. So we decided to look if there was any correlation between the tester’s given budget per person in the family, vs their final response:

Given vs Estimated Budget pp

Some responses to sacrifices focused on food items that were not a part of the game, such as rice, wheats, condiments, and beverages like coffee or tea. Other testers mentioned that they had to cut out fast food or junk food and snacks for the sake of their budget. One tester mentioned that while they would have loved to buy more fruits and vegetables, because they don’t provide a lot of calories, they would be a bad choice with a very limited budget.

For the testers that received a lot of money, they felt that the game was so easy that they didn’t have to make any sacrifices.

Changes

If we had more time to work on this, we would play around with different ways of displaying the game to make it more engaging, as well as adding more food items that people have mentioned that weren’t there. We would also make the game more difficult, since the goal is to start a conversation with how hard it is for some SNAP users to eat healthy. Other changes include not allowing people to enter negative amounts to gain money, and adding discussion about how the score is calculated. Something else to include is more familial context — grocery shopping is very different with children or expectant mothers in the midst, and these situations can make the experience more realistic and thought-provoking.


Color Scavenger Hunt: Playtesting Edition!

Goals
Our major goals in designing this game is to make the museum visit a more active experience and to engage visitors who may otherwise not be invested in art. To that effect, we had two main questions we wanted to find out during our playtesting session:
1. How does the color matching game engage you in looking at works of art?
2. How might color data (and other kinds of art data!) enhance the experience of visiting art museums, especially for people who find art intimidating or uninteresting?

Process
As we described in our last post, we intended for our game to be played in a museum gallery. Visitors receive colorful objects that match with one of the top five colors in the paintings on view. They are asked to match the objects to the colors in the paintings, using a scanner to verify their matches.

Screen Shot 2015-05-05 at 12.03.23 PM

Since we didn’t have time to build out the infrastructure for this game, I prototyped the game in HTML page, which included images of four artworks. I gave playtesters four colors that are found in each work of art; they were asked to match these colors to the paintings. They could then click the “get results” hyperlink to be directed to a website that reveals the top five Crayola colors in the work, including the name of the colors and the percentages of each color in the painting.

Screen Shot 2015-05-05 at 12.03.00 PM

One of the major challenges in designing the game was balancing the difficulty level. We had initially included seven works of art, several of which had repeat colors (“Eggplant,” for example, showed up in three paintings). For the purposes of the playtest, we decided to simplify the game so that each color a player was given would correspond to one painting. I also tried to avoid including really ambiguous or similar colors, so one person wouldn’t feel frustrated trying to differentiate between “brown” and “raw sienna.”

photo (6)

Findings
Playtesters enjoyed the game, and reported that it made them look closely at the paintings and had them think about art in new ways. One tester said that the color matching element made them think about how a work of art is made; he would have liked to have matched multiple colors to a work of art in order to think about color in combination with others. He could imagine seeing the bar graph representing the breakdown of colors underneath a painting in a museum. Another tester enjoyed seeing the percentages of colors in each painting.

photo (7)

If we were to continue building out this game, we recommend testing out different difficulty levels with different audience groups. A next step would be to think about how to engage visitors in learning about the art beyond just matching colors. How might this game serve as a gateway into learning about art and artists?

SNAP at the Grocery Store : Game Testing

Our game takes place at a grocery store. We ask a participant to do their normal grocery shopping, and at the end, ask them to put items back until they reach the USDA Thrifty Food Plan budget. Our goal is to create empathy for SNAP recipients and the constraints they face while shopping for food.

After the participants finished choosing their items, we told them that 13% of people in Massachusetts used SNAP, that the USDA assumes you will spend 30% of your monthly income on food, and that SNAP is meant as a supplement to get you to the 30% number. We had a conversation around this information, and asked them:

How did it feel to put things back/how did you choose?
Do you think you could do this if you were on SNAP?

Overall, our game had mixed results. Here are some of the issues we encountered:

Participant “won” the game

One participant, who was shopping at Whole Foods for 2 weeks worth of food for himself, was very close to USDA Thrifty Food budget of $90 – he clocked in at $83. When challenged to get down to $60, he took out the wine (which he wouldn’t have been able to buy with SNAP anyway), some passion fruits, oatmeal and a few yogurts, which to him, did not represent a particularly large sacrifice. His reaction to removing these items, and the larger game was, “I feel neutral.” The participant, who works as a lab tech at MIT, is already on a tight budget and already considers himself budget savvy, so the fact that the came in under the SNAP budget was more an affirmation of his own budgeting skills.

Similar reaction was received by another participant who is an undergraduate in MIT and had a particularly tight budget for the coming week. In her reflection, she said “it was hard to focus on other people’s situations because I was already on a tight budget”. We realized our game made this participant (on a tight budget) focus on her own situations rather than the difficulties of people on SNAP. This took the focus away from feeling empathy for the SNAP recipients.

In the future, we should have a better debrief in the case that the participant doesn’t have to put a lot of items back. This also raises the question – how does this game make people who are on a tight budget, but not SNAP, feel? It needs to be super clear that the participant should focus on the SNAP recipient’s difficulties, rather than compare their own situation – it’s about putting themselves in different shoes.


Game took too long to run

Participants also commented that the game took a long time to run (tallying up the cart, debrief) – they felt that it slowed down the shopping process considerably. For example, participants were concerned about frozen food melting during the debrief. In general, participants might not have time after finding all their groceries to participate in this game, so we should try to speed up the process as much as possible.

We also noticed that it was a pain to follow someone around and log everything they put in their cart (“Wait, what did you just put in?”). For example, one participant doesn’t typically weigh his produce, but we asked him to for our game.

Shaw's - Before
Shaw’s – Before
Shaw’s After

Participants don’t do all their shopping in one place

Another participant (Male, 45 shopping for 3) has habits in terms of grocery shopping. Splitting his budget in different locations like Costco (for the bulk and longer term products) and Market Basket (cheap fresh produce and smaller quantities). This makes it harder to assess what amount of money they should be aiming to meet for the game.


Market Basket – Before
Market Basket – After

 
Other notes

We realized this game doesn’t take into account whether someone eats out or not during the week. One participant came in under the SNAP budget, but would have easily gone over if we counted what they spent eating out during the week. To make the game more realistic, we’d want to subtract the amount spent eating out from the SNAP budget at the grocery store.

Costco

Rain Storm Game Testing

Val Healy, Nolan Essigmann, and Ceri Riley

Questions: 

  • Could you hear a difference in sound levels/did it make you think anything different about US drought?
  • Where/what have you heard about drought in the news? (leading into the idea that this data was averaged/nationwide)
  • What questions do you have after playing the game? (about the game or about your role in representing drought)

Feedback:

  • It would be nice if each person/notecard represented a region of the US instead of just a percentage of the whole, so everyone could understand how their region was contributing to the whole country (they were confused by what each notecard meant individually)
  • Why no “no drought” level?
  • Made them ask questions about what factors — human or environmental — impacted the US drought after 2011, and they started talking about climate change vs. industrial water use vs farming (they had read news articles about almonds in CA and remembered stuff about the ice bucket challenge being controversial)
  • One of them was from Arizona and was like they’ve been in drought for years, but California is getting all the attention because of the crops, so they weren’t surprised that more of the US was in drought than they expected
  • People thought 15 rounds of one action might get tiring, and the people who did stomp for 15 rounds got tired
  • They’d be interested to see what it sounds like with more people because even 14 didn’t sound like enough to have a huge audible effect

Changes:

If we had more time to work on this game, we would ideally play with a large group of people and incorporate more specific data into each notecard so that each person is telling their own story (drought across a region or even a single state) in addition to contributing their sounds to the larger game (and story of drought across 15 years in the United States). Moreover, it might be interesting to try and adjust the drought levels/actions to incorporate “no drought” as stomping and D4 as silence. Maybe we could also adjust the frequency of the actions (fast stomping, slow snapping) to try and vary the sound even more between years, like the feedback in class suggested.

Food Security Simulator

In creating this game, we used the USDA’s report on SNAP participant characteristics to understand the types of people who participate in SNAP and the budgetary choices they face, combining it with datasets on average monthly rent in Massachusetts, consumer goods prices, and some of the previous SNAP data we’ve worked with.

Audience

This game is targeted at the general public, especially those who do not know much about SNAP and who SNAP participants are. We estimate this game to be appropriate for groups of 3-4, but it can easily be adapted to accommodate different numbers of people, though the mechanics (particularly the scoring system) probably need to be refined with further playtesting.

Goals

The goal of this game is to give people a better understand of who participate is SNAP and some of the challenges they face. This is presented as a role-playing game, giving each player a persona that not only defines their financial constraints but also provides some emotional grounding. In presenting this information in a personal way, we hope to increase the empathy that people feel toward SNAP participants and even compel them to take action.

Game Description

See all cards here:
https://docs.google.com/document/d/1g9vWCH7c012bANVJdRLbYHQP4SbMPxgKfKHhb5-5Xsc/edit

At the beginning of the game, each person draws a character card. This card gives them information about who they are and how much money they can spend.

In the first round, each player must decide how much of their money to allocate towards food. They are given no direction, and allowed to come up with their own numbers and told to write them down on a sheet of paper. This sheet of paper is then turned over and set aside.

Each player then draws an Event Card. Event Cards can be positive or negative changes in the character’s life – for example, it could be something like a work-related injury (resulting in medical fees or reduced productivity) or getting money from relatives. Blank Event Cards indicate that nothing of significance happened to the player in this round.

In the second round, players are given housing options to choose from. They are given concrete options, each with a set price and any additional associated costs, such as transportation and utilities, provided to them.

After this round, each player again draws an Event Card.

In the third round, players are given additional options for things to buy, such as clothes, toys, cell phone, etc. They may choose to buy as many of these as they want — these provide bonus “happiness” points.

Again, each player draws an Event Card.

At this point, players are scored based on how well they met their needs (food, housing, and other purchases) and stayed within budget. As a post-game reflection activity, the players are again asked to decide how much money they would like to spend on food, revising their estimates based on how well they did in the previous round. Finally, players are asked to compare their initial and final food budget allocations.

SNAP at the Grocery Store

Goal & Audience

Our goal is to inform the general public about the reality of food insecurity and build empathy and understanding. In particular, our game focuses on how SNAP benefits work and how it “feels” to use them in a real world setting – the grocery store. We acknowledge it is impossible to fully capture and simulate the entire experience of food insecurity, but our hope is that by placing the participant in the setting of a grocery store, which many people take for granted, we can introduce unfamiliar experiences to a familiar setting.

Game

Our game takes place in a small grocery store that we have set up, akin to Shaw’s. When the participants enter, we ask them the following questions:

1.How much food do you buy at a time? (1, 2, 3, or 4 weeks)

2.How many people are you shopping for?

We then ask them to do their shopping based on those answers. When they are ready to “check out,” we total up the prices of what they’ve bought. Then, based on how many weeks of food they are buying and how many people they are shopping for, we tell them how much the USDA Thrifty Food Plan (and by extension, SNAP) allocates for them to use, as well as the average SNAP allotment in Massachusetts. See our data here.

We then ask them, what would you give up to get down to the Thrifty Food Plan allotment? What would you give up if you SNAP was your only budget for money? Based on this, we ask them to put food back. This experience, of consciously deciding what to give up, and physically putting it back, can simulate the budgetary constraints food people on SNAP face daily, and help build empathy.

Finally, we take pictures of the before and after carts. A collection of these pictures will be shown to the participant at the end of the experience.

IMG_0364
Original food basket for 1 person: $83
IMG_0367
Version after we tried to cull to $45, was actually $51.


Final version - still only got down to $42, trying to get to $30.
Final version – still only got down to $42, trying to get to $30.


Notes

We tested out the idea on ourselves at a local Shaws, though given more time, we would have liked to try it out on a general audience and use prices that are not as high as the Cambridge Shaws. If we were to deploy a real version of this game, we would like to set up our own mini grocery store, but if that is not possible, then consider doing it at a real grocery store (though we haven’t thought through the details of that).

Here’s the data for what’s in our carts.


Weeks of groceries
People In Household Maximum Monthly Allotment (Thrifty Food Plan) 1 Week 2 Weeks 3 Weeks 4 Weeks
1 $194 $49 $97 $146 $194
2 $357 $89 $179 $268 $357
3 $511 $128 $256 $383 $511
4 $649 $162 $325 $487 $649
5 $771 $193 $386 $578 $771
6 $925 $231 $463 $694 $925
7 $1,022 $256 $511 $767 $1,022
8 $1,169 $292 $585 $877 $1,169


Weeks of groceries
People in Household Massachusetts Average Monthly Allotment 1 Week 2 Weeks 3 Weeks 4 Weeks
1 $122.86 $30.72 $61.43 $92.15 $122.86
2 $245.72 $61.43 $122.86 $184.29 $245.72
3 $368.58 $92.15 $184.29 $276.44 $368.58
4 $491.44 $122.86 $245.72 $368.58 $491.44
5 $614.30 $153.58 $307.15 $460.73 $614.30
6 $737.16 $184.29 $368.58 $552.87 $737.16
7 $860.02 $215.01 $430.01 $645.02 $860.02
8 $982.88 $245.72 $491.44 $737.16 $982.88


Data game: color scavenger hunt

Location: Museum (or wing of a museum)

Team size: 3-5 people

Audience: Children and adolescences who may not yet be invested or engaged with art.

Goals: Make the museum experience more active and more goal oriented to engage new populations with art.

Game process:

Each team receives a bag full of everyday objects at the entryway of the museum.  Each object in the bag has a distinct main color that matches to a major color in one of the art pieces in the museum.  Objects also contain a small identifier code.

Once all teams are prepared, they are released into the museum to match their objects to the art pieces.  When they find a piece that they believe matches one of their objects, they scan the identifier code on that object to verify it, and then leave the object by the piece if it is correct.  A system keeps track of the successful matches for each team, and the team that matches all their objects first is the winner.

Data: Color data from artworks and from pictures of the objects of interest.

Team: Laura and Desi

Data Game: SNAP Simulation

Background

The average recipient of SNAP in 2015 receives $122 per month. SNAP is meant to supplement, not replace the food budget for a person in a given month – it is intended to cover 30% of that person’s monthly food budget. This means that the projected monthly food budget for a single person is $406.

That leaves about ~$100 a week for groceries. Not every family can afford the extra $70/week though, and as a result some families rely on SNAP to account for more than 30% of their food budget.

The Simulation

  • Construct your family:
    • A player starts by rolling a dice (1-6) to determine the size of his/her family
      • Surrounding players will join that player’s family, depending on the outcome of the dice roll.
    • If family size  > 2, each subsequent person is a child. Each child rolls the dice (1-6) to determine his/her grade: grade=n*2.
    • The head of the family rolls the dice (1-6) to determine starting cash (range $50-$100) for each person.
      • Each member of the family receives $((n x 10) + 40)
        • (a roll of 6 represents the expected budget, where SNAP accounts for 30% of total)
  • Acquire Food:
    • The goal of the game is to plan the most nutritious, delicious, and caloric diet for the week.
      • Each person in your family should consume at least 2000 calories, regardless of nutrition.
    • Go shopping (grocery store/restaurant) and select food and/or meals for purchase.
    • Children receive extra calories from school lunches (5/week) that can be counted towards the family total:
      • K-5: 550-650 Calories
      • 6-8: 600-700 Calories
      • 9-12: 750-850 Calories
  • Winning:
    • A judge will calculate the nutrition of the purchased foods.
    • Round winner is the family whose food  purchases come closest to the daily recommended values for macronutrients (carbohydrates, fats, and protein) and closest to the 2000 calorie/person/day total. Lowest score wins.
  • Scoring:
    • A family’s score is calculated according to:
      • { (|C – 14000*n|/14000*n) + (|SF – 140*n|/140*n) + (|Uf – 315*n|/315*n) + (|Cb – 2100*n|/2100*n) + (|P – 350*n|/350*n) } *100 – 1*(num unique items purchased – more variety!)
      • Where the variables are defined as:
        • C: Calories
        • Sf: Saturated Fats (Recommended 20g per day per person)
        • Uf: Unsaturated Fats (Recommended 45g per day per person)
        • Cb: Carbohydrates (Recommended 300g per day per person)
        • P: Protein (Recommended 50g per day per person)
        • n: size of family

Audience

Our audience is the general public, but we would specifically target middle to upper-class households.

Goals

We aim to invoke empathy from our users by showing them how hard it can be to put together a nutritious, caloric meal on a low-income budget. Our previous research into this subject has shown a correlation between obesity and poverty, and obesity is stereotypically associated with unhealthy eating. As a result, we would like to put the dietary decisions in the hands of those who perpetuate the stereotypes, to see if they would/could make different choices.

Moving Forward

Our game relies heavily on number crunching and calculation. As a result, we would like to turn this into a JavaScript based simulation with a simple user interface, so that our goal of invoking empathy in users will be less shrouded by the sheer amount of spreadsheet lookups and score calculation that the game in its current form requires. Creating a web-based version of the game would not only speed up its pace, but would also allow players/families to explore alternative choices of foods and experience different outcomes.

Data Sources:

Prices taken from Market Basket Somerville Weekly Circular.

https://docs.google.com/spreadsheets/d/11HRyI6HOE-xrhhNYnuA5jJWkKTOiJN8QNsrwBDnWHUY/edit#gid=0

http://www.fns.usda.gov/sites/default/files/pd/18SNAPavg$PP.pdf

Edwin Zhang, Harihar Subramanyam, Tami Forrester, and Danielle Man

Human Rain Storm Game

Val Healy and Ceri Riley

For this assignment, we used averaged weekly drought data from 2000-2015 to modify a camp game where people make sounds to mimic a rain storm.

Audience 

A large group of people (the more people, the greater the effect of the game), either children or adults, who are interested in producing a sonic representation of drought over several years. This game can communicate the effects of drought to people in a more interesting/engaging way than looking at different colors on a map.

Goals

The goals of designing this game was to link the long-term impact of drought on the United States to an auditory/participatory experience, which would ideally be more memorable than looking at one of the many choropleth maps online. It sums up a large amount of data on drought (~783 weeks) in a short activity. And the activity represents how drought changes over the years, with various levels of drought (lack of water) correlating to different types of water-sound-producing actions in our game.

Game

This game works better with more people and no ambient noise/talking — the only noise should be coming from your actions.

The leader will distribute notecards to each person. These notecards will have 15 years (2000-2015) and an action next to each one that corresponds to a level of drought.

Optimized-explaincard Optimized-notecards

Then, the leader will stand at the center of the circle and have a sheet of paper with the year “2000” on it. They will walk around the inside of the circle, holding up the year, and point to each member of the circle in turn. When the leader points at you, you perform the action that your card says for that year.

After the leader will continue to walk around the circle, increasing the year by one each time, until everyone is performing their “2015” action.

Then the leader will walk around the circle one last time, pointing at everyone individually to stop performing their action. This signifies the end of the rainstorm and the activity.

Because there are only 14 people in our class, we scaled the activity to 14 notecards for the demonstration. However, we also did calculations to see what the different sound/action distributions would be if we included the “No Drought” category and if we had a larger group of 100 people all doing the activity.

14spreadsheet 100spreadsheet
Screen Shot 2015-04-30 at 3.45.24 PM