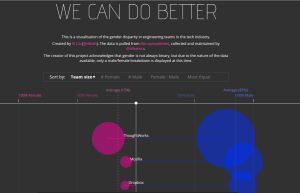
Though several large tech companies like Google and Facebook have released numbers on gender and racial diversity in its workforce, there is comparatively little data about the workforces of smaller, fast growing companies, such as AirBnb and Github. To remedy this, last October, Pinterest engineer Tracy Chou surveyed employees at these companies directly, asking them to self-submit their data. Chou collected and aggregated the information into a public spreadsheet.
Chou’s data forms the basis of this visualization, titled “We can do better,” created by Ri Lu. Each company is represented by two circles, whose size is proportional to the number of men and women in its engineering workforce. The circles, colored pink (women) and blue (men), are placed on a horizontal axis, where a 100% female workforce is on the leftmost end, and a 100% male workforce on the rightmost end.
Based on the title, “We can do better” and the use of the term “gender disparity,” it’s clear that the goal of this visualization is not only to highlight the gender imbalance in engineering teams at these tech companies, but also to suggest the companies do something about it.
The visualization is effective at achieving the first goal. There is a noticeable difference in sizes of the two circles and most of them are closer to the right side of the axis, showing a clear skew in the number and percentage of men.
However, I think this visualization lacks context around why this gender imbalance occurs and what people can do to help. In the absence of clear, persuasive advocacy, perhaps with supplementary text, people may walk away with the idea that this imbalance is not a real problem, or that there is no solution.
Additionally, because the data was self reported, it may not be 100% accurate, but this fact is mitigated by the clear trend that manifests. The visualization also acknowledges the limitation that gender is not binary, though it only displays a M/F breakdown at this time. Finally, gender is only one aspect of diversity of a company. A more complete visualization, or set of visualizations could include information about race, class, etc.
