What can you do? What kinds of stories is it good for?
Piktochart is a great tool if you want to create an aesthetically pleasing infographic easily without having to learn how to use professional software like Adobe Creative Suite or spending the time to create your own vector art (although you can upload your own images if you want). Its tagline “Easy-To-Use Infographic Creator: Discover how non-designers are creating beautiful infographics in as little as 10 minutes” is a little bit click-baity but rings true.
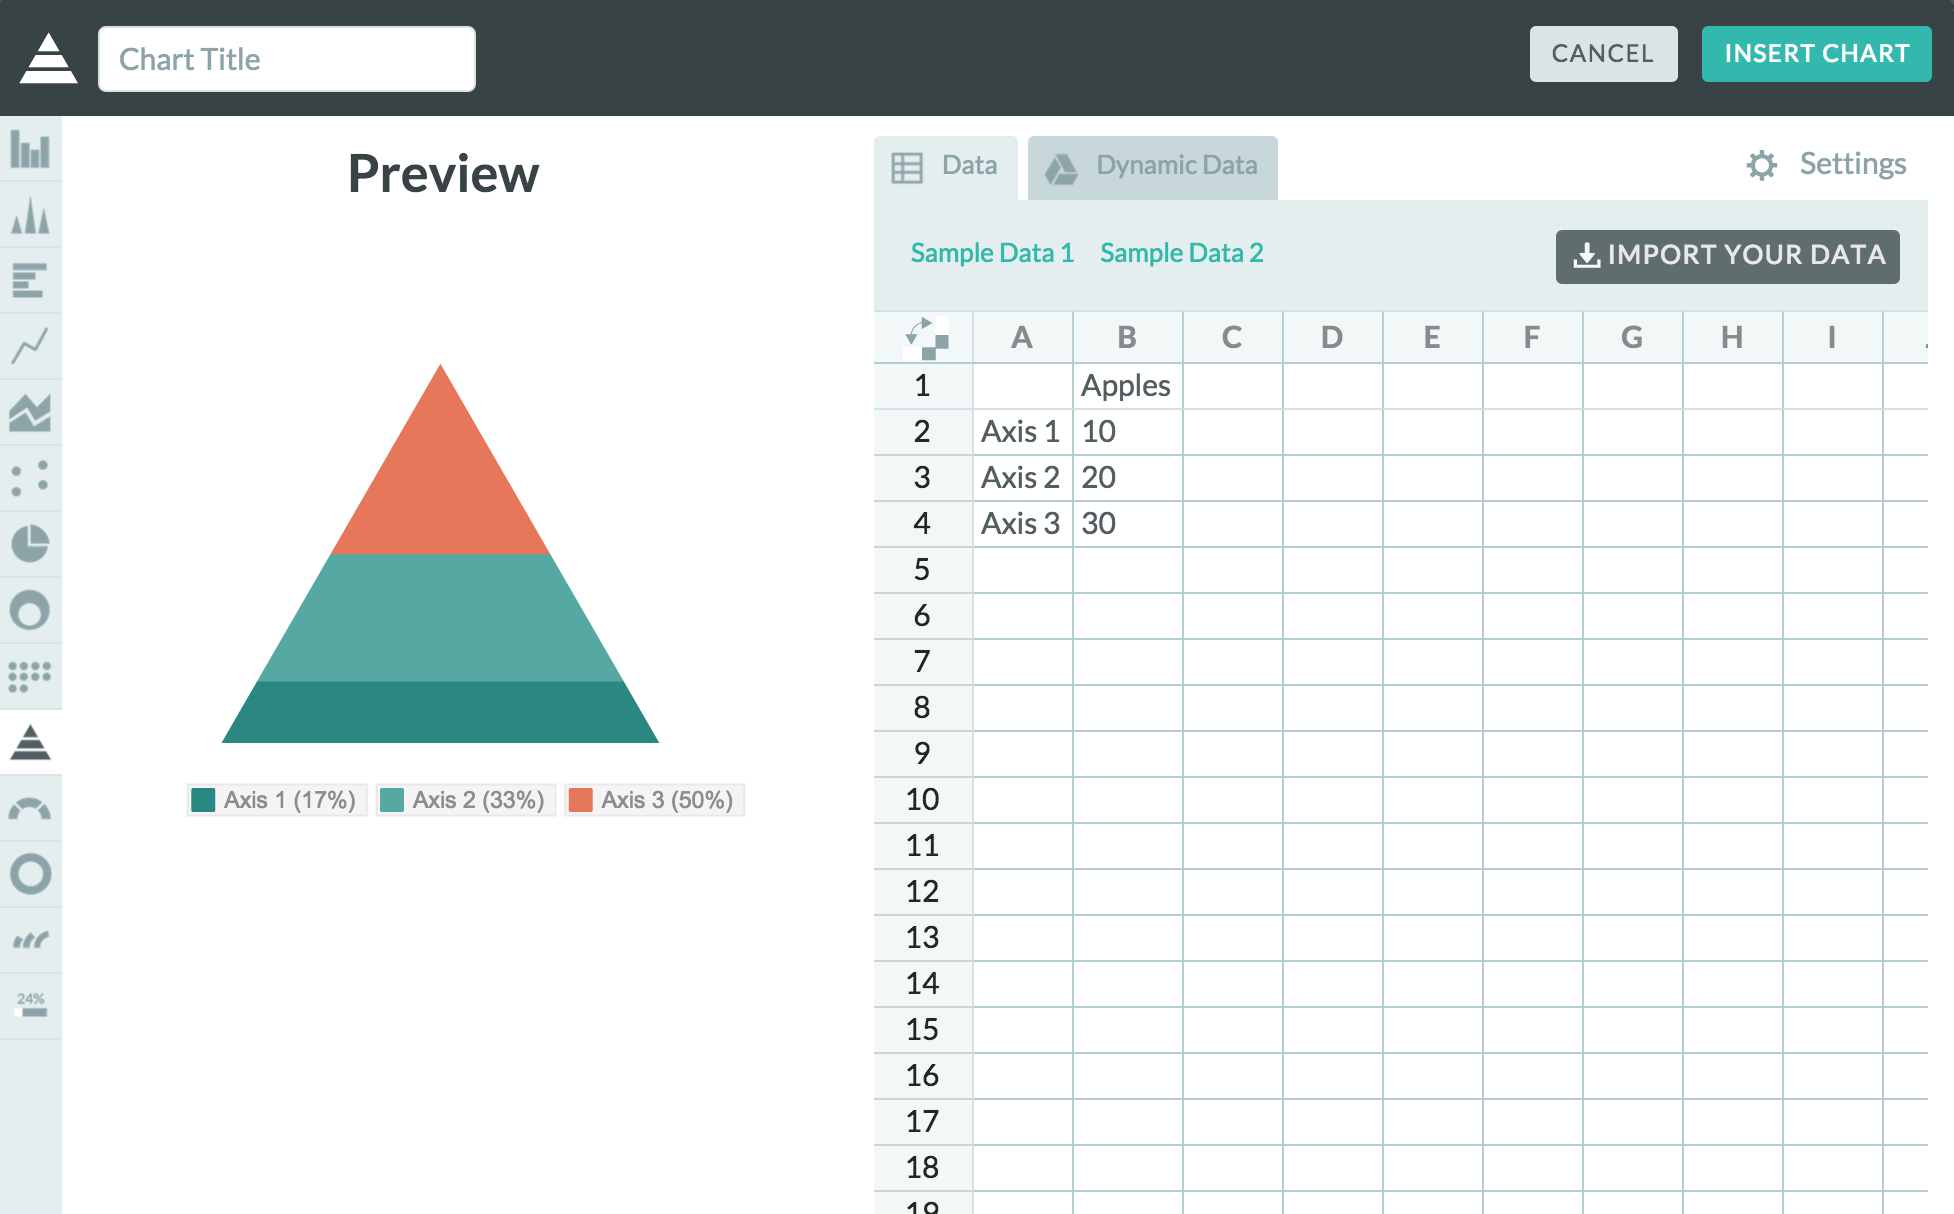
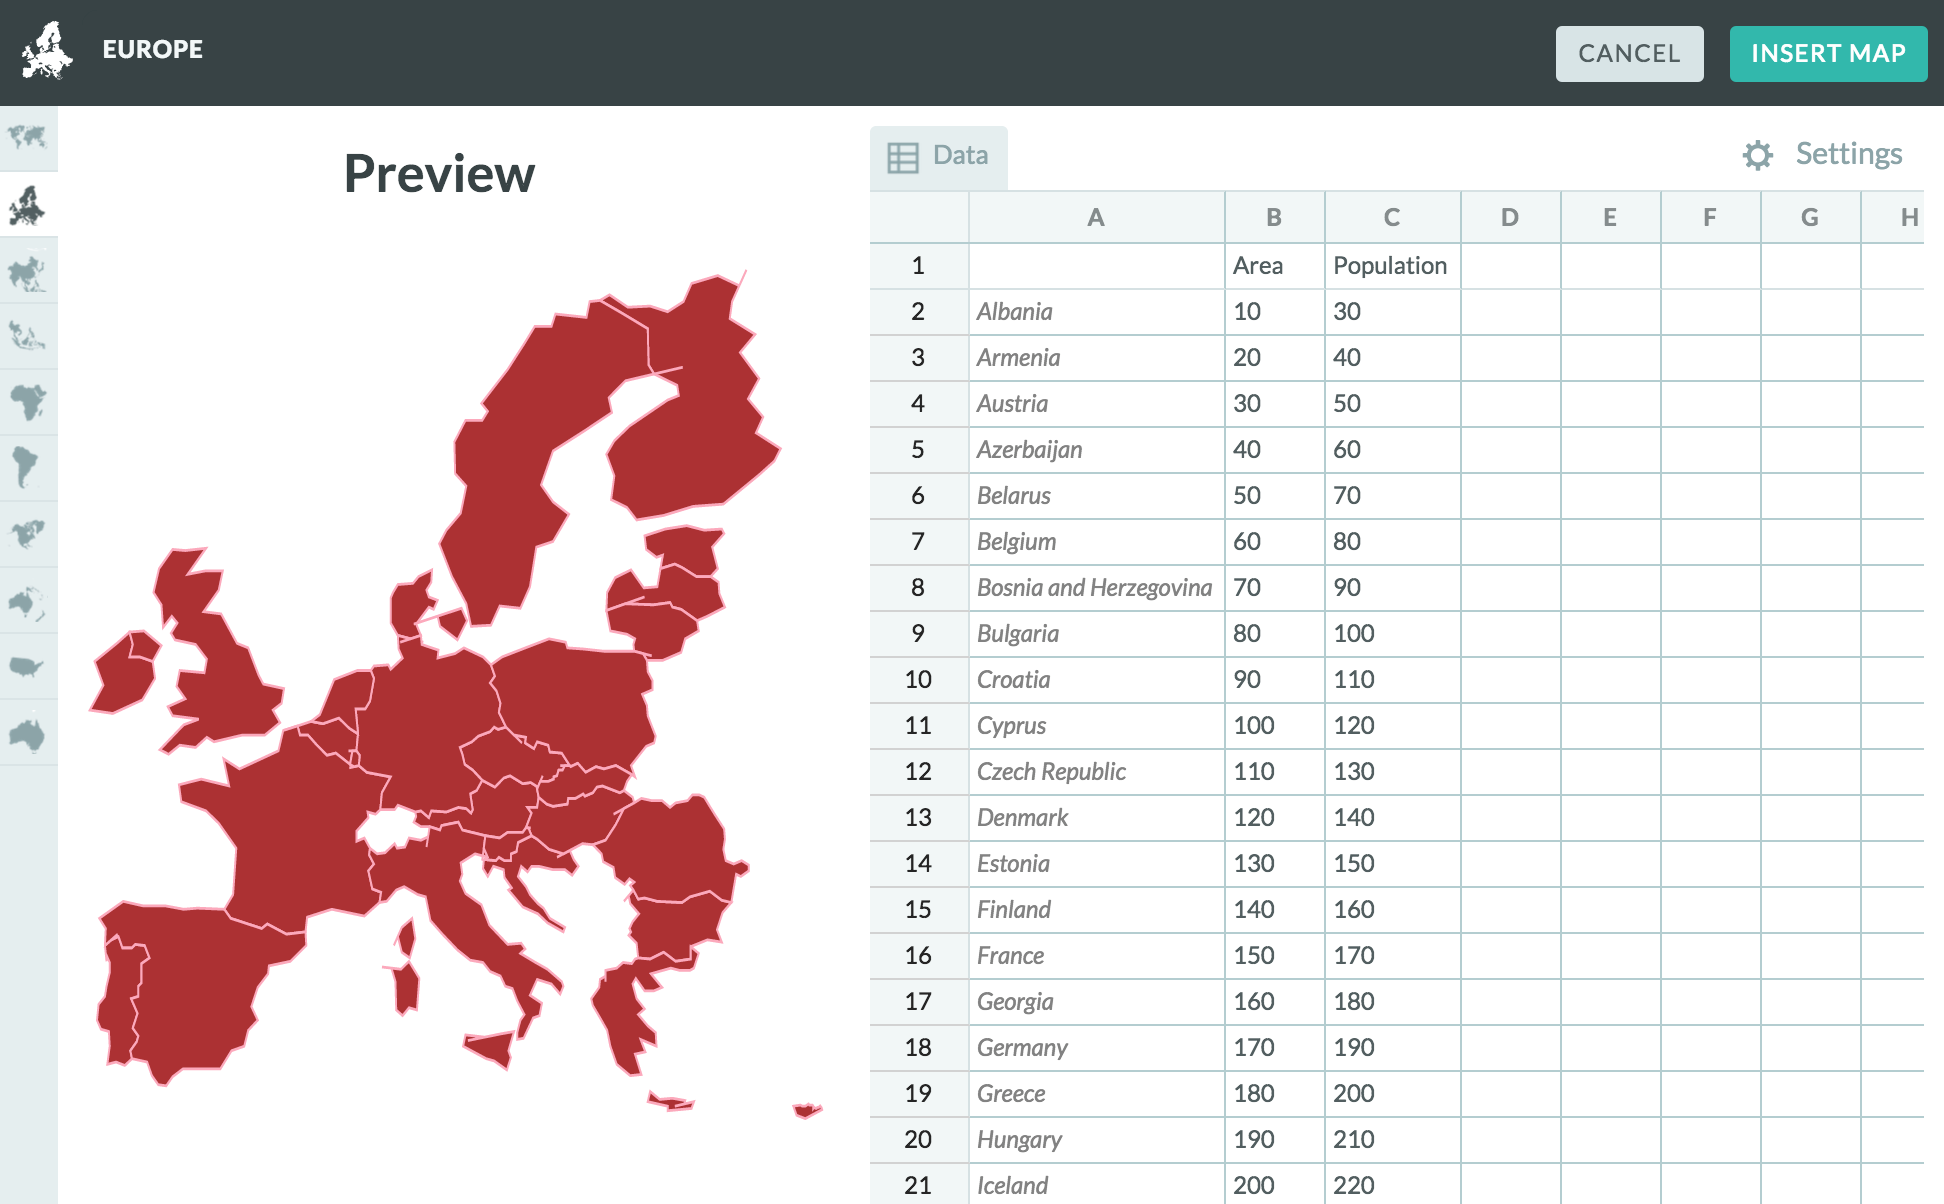
This tool is useful for presenting any sort of data story in a creative, graphical way. Piktochart is pretty customizable, with many different simple icons and background templates that you can insert, a variety of professional-looking fonts, and the option of generating basic graphs and maps. So, after you’ve conducted data analysis and narrowed down the key information you want to present, it’s a great tool to summarize your story in a clear and eye-catching way. (Alternatively, it can be used to make something as simple as an event flyer, because it’s basically a simplified graphic design interface).
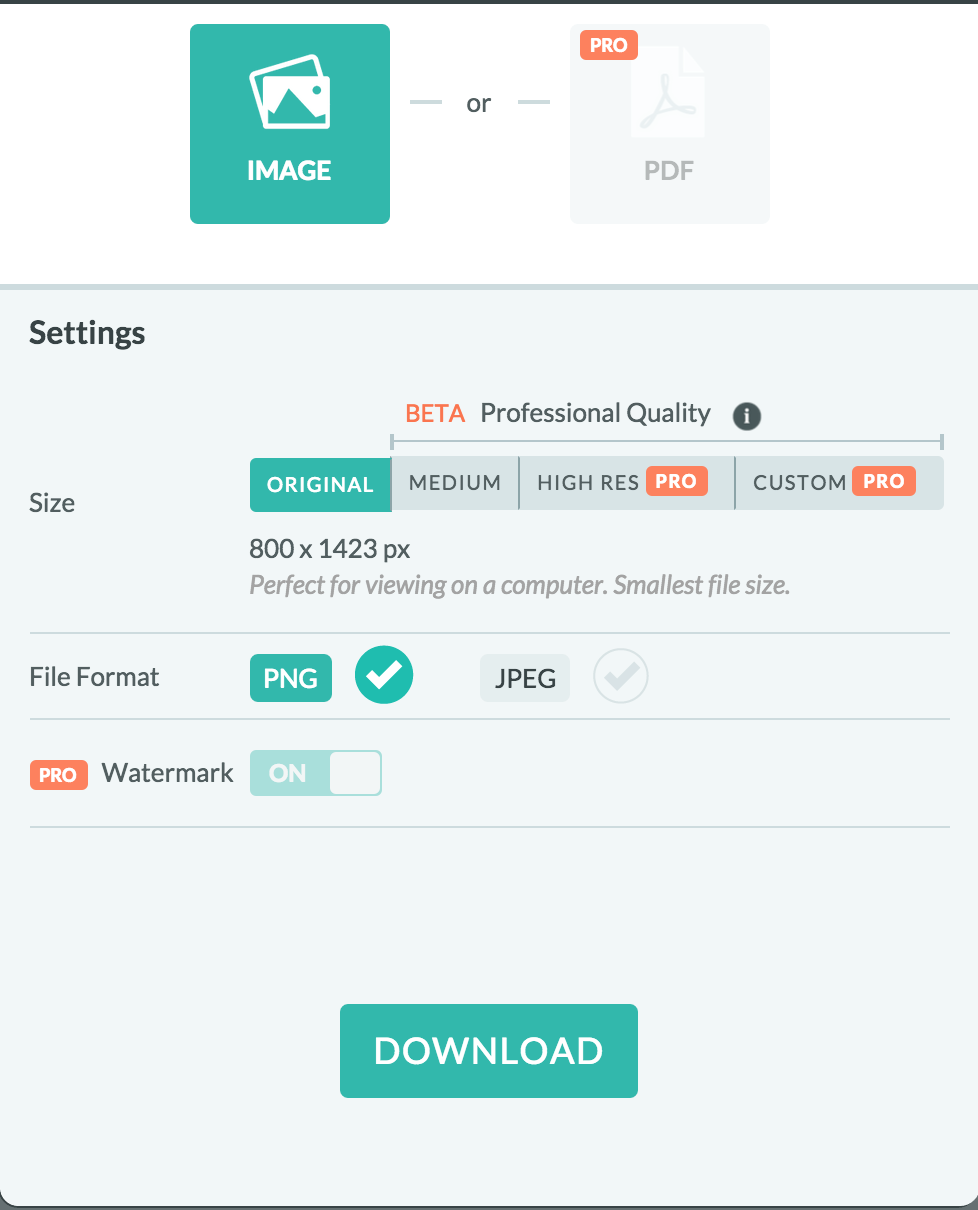
However, the tool does have its limitations, as your exporting options are fewer without upgrading to the paid ‘pro’ account. The customizability is pretty broad (fonts, colors, opacity, positioning, etc.) for a user-friendly graphic design tool, though, so it should be more than enough for people to at least play around with the design.
How do you use it?

Before you begin making your infographic, you have to register as a user and make an account. From there, the website guides you through a selection process of a background style for your visualization (either a pre-set design or a blank page). You get a nice tour of all the tools (and can return to it by clicking on the “TOUR” icon in the lower left corner) and then can jump into creating your design by adding text, images, color, and charts/maps.
In addition to having live support to answer any questions you have, there’s an FAQ section that covers a breadth of questions you might run into.
How easy or hard is it? What skills do you need?
It’s very simple to learn and the layout is very user-friendly — everything is clearly labelled and the options (for example, ways to manipulate text) are presented clearly in the sidebar or header. Like any tool, there’s a bit of a learning curve, like figuring out how to search for icons or how to select different portions of the document, but it makes graphic design very simple for all sorts of users.
Would you recommend this to a friend?
Yes and no. I would recommend it to a friend if they want to play around with making graphics (or need to make one quickly) and don’t have the time to download/learn software, whether it’s something like GIMP or Adobe InDesign. The fact that you have to pay to get a non-watermarked and high-resolution infographic, while expected, can be frustrating if you want a very clean image for free. But overall it’s an easy way to start playing around with visualizing stories and really simple to use, so there are more positives than negatives.
Will you consider using it for your final data story?
I might consider using it, but would prefer not to. It seems like a good platform to roughly draft ideas into an infographic, but I’m also coming into this class with some art/graphic design skills. If I’m going to be presenting a project with images, especially if it’s something like an infographic where the images are the most memorable part of it, I would MUCH rather spend the extra time to draw/create those images myself rather than using some stock icons from a website.
Yes, Piktochart can help make a simple, clean visualization, but I’d much rather practice my own digital art skills when presenting a data story I helped select. It makes it more unique and personal (maybe even a portfolio piece), rather than something just anyone could throw together with a stock background online, however professional/easy it may be to use this tool.