Mapbox is a cloud-based tool for publishing customizable, interactive maps. They provide maps for a lot of major services you know—Foursquare, Pinterest, and Uber are just a few. Mapbox builds on and authors a lot of open source mapping libraries; for example, their map data comes from projects like OpenStreetMap. As a freemium service, you can get a free account for limited map views, storage, and support, or pay more for premium features. One of the great things about Mapbox is that it is designed for various levels of technical expertise. If you have no coding skills, it is incredibly easy to use via the Map Editor; for developers and designer, you can add interactivity and customize the visual style using Mapbox.js and Mapbox Studio.
The Map Editor is the quickest way to create a map. Mapbox maps consist of a baselayer—the map—and overlays—the data you add onto it. You can choose many baselayer styles, from the hip and nostalgic theme “Wheatpaste” to the streamlined “High Contrast.” Data overlays take on three forms: markers (points referring to a single place), lines (the distances between two places), and polygons (areas bigger than one or two places). A user can add these features by dragging and dropping, or by importing a file (.geojson, .csv, .kml, .gpx) that includes latitude and longitude fields. You can also customize the color and icon of these data features.
Publishing your map is easy. You can view the map directly at a Mapbox URL, embed your map into a website with HTML, download data features from your map, or use your map ID to treat it like an API.
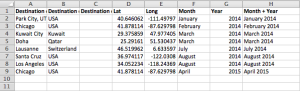
I decided to represent where my class of 2015 student cohort in Comparative Media Studies has traveled as part of grad school experience. I prepared simple .csv files and uploaded them. Within minutes, I uploaded the data and made a map with a funky background as well as customized the markers, assigning a color per student and a letter that corresponded to his or her first name.
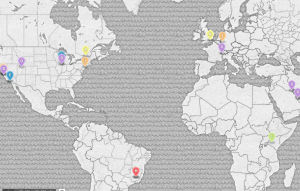
Still, I ran into some problems that couldn’t be addressed just through the Editor. For example, several of us traveled to the same city, often at different times. Because the lat/long I entered for these data points were the same, the most recently added marker would always cover the others in the same location, making it seem like there was only one data point there.
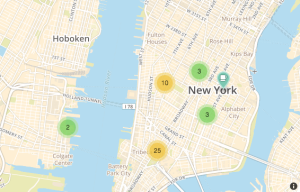
The open-source Javascript library Mapbox.js is a way to sidestep these kinds of issues and add exciting, interactive features. Mapbox describes itself as “developer-focused,” championing the fact that their maps can be altered for your project’s functionality needs. For example, a short JS script could be inserted into my HTML that clusters markers together, using a numeral that indicates how many markers are in a tight space.
Mapbox Studio is geared toward the design of the map. This platform allows you to apply your own styles, customizing everything—from roads and parks to bodies of water and location names—to your (or your brand’s) needs. The platform builds maps using vector tiles, which combine the strengths of tiling images with vector data. According to their website, vector tiles “rethink web maps from the ground up, providing a single efficient format to power raster tiles, interactive features, geojson streams, mobile renderers, and much more.” You can style maps by using the CartoCSS styling language.

I would definitely recommend Mapbox for an data storyteller who wants to tell their story via maps. Mapbox provides great documentation and a beautiful, easy-to-use interface. The tool is easy to use for beginners, while highly customizable if you have coding or design chops.