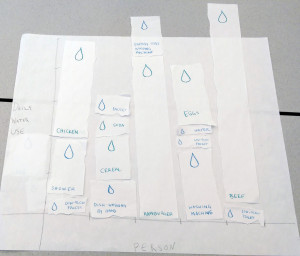
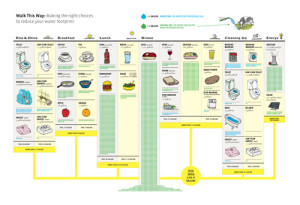
For this assignment, we were challenged to remix the Good magazine water infographic into an interactive, participatory experience. In our design, users can visualize their own water usage by selecting the activities they undertook that day.
We found that the original infographic, organized in columns with options like “apple” vs. “orange,” or “toilet” vs. “low-flow toilet,” could serve as the interface from which a user select items. On another screen or window, a bar graph would dynamically fluctuate as the participant indicates his or her water consumption. The height of each bar is proportional to how much water each activity or product requires. We also maintained the color-coding from the original chart: bars with blue indicate direct use of water, while green indicates the water used to make that item the user the consumed. By recreating this infographic into an interactive chart, we personalize the understanding of water consumption, allowing users to apply the information in the original infographic to their own lives.

