Data & Story
In 2012, roughly 46.6 million people participated in SNAP. According to the 2012 USDA Retailer Policy & Management Division report, 27.66% of the retailers that accepted SNAP were grocery stores, supermarkets, or superstores, while only 0.76% were farmers markets. Additionally, 87.38% of the SNAP benefits were redeemed at grocery stores, supermarkets, or superstores, but only 0.02% at farmers markets.
There is a paucity of farmers markets that accept SNAP, but as we saw in the Rapid Assessment Response and Evaluation of Food Insecurity in Somerville, there is also a demand among those who are food insecure for fresh fruits and vegetables.
We want to highlight this issue for the general public. Our goal is to draw attention to the very small number of farmers markets that accept SNAP nationally show physically how the scarcity makes access to the farmers markets more difficult.
Data sculpture
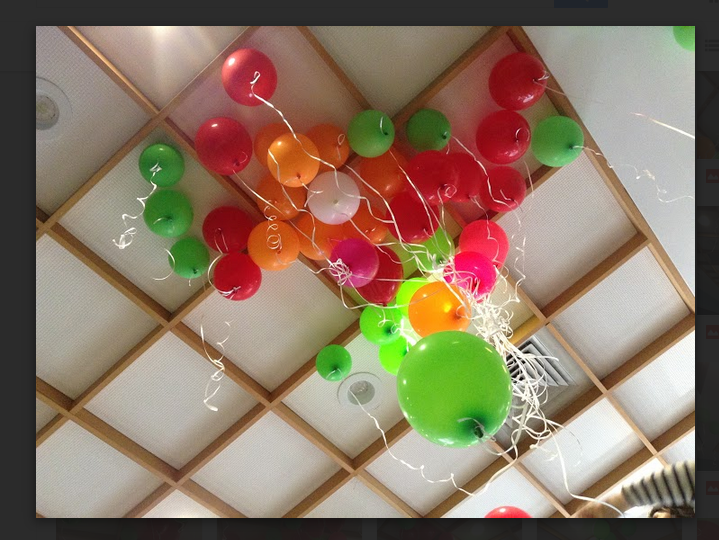
To do this, we made a data sculpture from balloons. Each balloon of a different color represents 4 major types of stores – grocery stores, superstores, supermarkets, and farmers markets. To show the lack of farmers markets, we have one white balloon to represent farmers markets, and proportionally many of the other categories. For example, superstores are 7.43% of all retailers, so there are 7.43/0.76 = 9 balloons for superstores. We chose these categories because they represent almost 88% of stores where all money was spent.
Arrangement
We arranged the balloons so that the white one (farmers market) was in the middle, while rings of balloons representing the other categories surrounded it. We also played around with different arrangements, such as having the balloons be more “random” and spread out in the 3D space so that they looked more like markers of real locations.