Snowday-pocalypse Data Log: 2/9/15

12am~3am

I tooled at my computer from midnight to ~2:59am doing the following:

– visited Stellar to download materials

– updated google calendar to account for snow day

– checked Tumblr several times

– checked emails

– created this document in google docs

– watched 10 videos of dance performance consecutively on youtube

3am ~ 11:30am

sleeep zzz

11:30am

Woke up after snoozing two alarms

Skip breakfast in the dining hall,

eat a bowl of instant oatmeal

All on iPhone:

– manually update apps

– download three apps after browsing the app store

– check FB messenger, Groupme

– check Gmail, calendar

Wore glasses instead of contacts

12pm ~ 2:45pm

Played Hay Day (real-time “farming” iOS game) for most of this time, but I also played a few rounds of Bejeweled Blitz and Two Dots. I also responded immediately to messages on Groupme and Messenger that were received on my phone

2:45pm ~ 7pm

This time is spent almost continuously on my laptop using the internet. Sites/activities included:

– Gmail

– Google Calendar

– Atlas

– reading Stellar assignments

– Re-enable Facebook News Feed and scroll through for the first time in several days (was previously using Kill News Feed on Chrome to block it)

– reblog a few posts on Tumblr

– respond to text messages on laptop

I received about 10 notifications from Hay Day, and checked the game each time. I eventually disabled the app from sending notifications, and did not play it for the rest of the evening.

9pm ~ 11pm

Download and watch movie for a HASS assignment

Update google calendar to reflect Tuesday school closing

Check facebook and tumblr before going to bed


A few totals:

– emails sent: 5

– emails received: 117

– emails trashed: 45

– text messages sent/received: around 50

– time spent online: ~10 hours


Deborah’s data log

Sunday, February 8

11am – 12pm: Check email on phone and laptop, respond to gchats, use water in bathroom

12pm – 1pm: Call two people, check email again.

1pm – 2pm: Check MIT shuttles & Nextbus for grocery shuttle on phone (uses phone location), forward and reply to emails (TA duties)

2pm – 3pm: Eat lunch at grocery store (utensils), use credit card to pay for groceries, obtain grocery receipt, check shuttle app multiple times, read a Medium essay while waiting. When I get home, tap my MIT ID into dorm, send more emails, call my sister, check Facebook, and update Stellar for class I TA.

3p – 4pm: Respond to Doodle poll, copy a google spreadsheet to assign grades, enter them into Stellar.

4pm – 5pm: Catch up on Internet reading – various sites (Atlantic, Wikipedia, HackerNews), call my family

5pm – 6pm: Search artist on Spotify iPad app, put on an album.

6pm – 7pm: Respond to intermittent gchats, check Facebook, look at website for class I’m taking.

7pm – 8pm: Get started on lab1 – lots of google searches, piazza, github, stackoverflow, various blogs. Look at sandwich recipe on AllRecipes, turn on oven, check Facebook, eat.

8pm – 9pm: More gchats, google state of Snowpocalypse, check Twitter.

9pm – 10pm: Look at bread recipes on food blogs, read about various foods (mostly first two pages of Google results)

10pm – 12am: Intermittent gchats, Internet wandering – check my news sites (Atlantic, nytimes, New Yorker, Hacker News, Gawker), watch Youtube, check Piazza, email

Tuyen’s 24hours data activity log

I was in New York last weekend so this relates the trip back home that shows a more data generated activity than a regular quiet weekend.

Sunday Feb 8

11:00 woke up in the hotel room no alarm clock

11:00 checked texts on my iphone to see if friends responded to my texts about D’angelo concert feedback.

11:30 took a shower, used water from the hotel

12:00 check out of the hotel room and use the hotel computer

12:05 booked some tickets for a Broadway show via credit card, on the hotel computer received confirmation email.

12:15 booked a table via Opentable for 2 for lunch (but never went)

12:45 went to a random Japanese restaurant instead

13:15 checked facebook and online reviews on last night concert

14:00 restaurant paid by credit card and got printed receipt.

14:30 walked on Times Square and took some pictures – my iphone tags the location of the picture

14:33 a camera on times square took my picture and shows on a gigantic marketing board for Revlon

14:40 arrived at the theater and pick up tickets at registration, barcode tickets were scanned.

15:00 show starts.

16:00 intermission, bought drinks with my credit card

17:30 going back to the hotel by subway, paid $10 metro card refill by credit card at the subway station

18:34 took the train at central park to West Haven. Tickets were bought the day before via credit card and were checked manually byan agent

18:40 listened to music on the train with Spotify on my phone

19:25 received text from MassArt closed on Monday

20:15 arrived at West Haven and picked up the car – security cameras in the train station.

20:20 used Google maps app for directions to Home

20:30 received email from MIT alert. School closed

21:00 collected a ticket for the toll

22:30 filled up the car with gas on Mobil station with the Speedpass – will get the bill at the end of the month

22:45 ordered some food and paid credit card

23:30 paid the toll $2.75 in cash – probably security cameras

00:00 arrived home safe, brush teeth- data will be reflected on water bill, city of Arlington

00:15 put the heater in the room – will be reflected on electricity bill

00:30 turned on Netflix to watch a movie, I searched by category foreign movies – and felt asleep.


Monday Feb, 9

08:30 woke up naturally– no alarm.

08:45 brushed my teeth and bathroom use- reflected on water bill, city of arlington

09:02 received texts on my phone, date and time tagged checked facebook, instagram

09:18 put the Netflix movie back- right where I stopped it the day before

09:30 replying to emails- connecting to home network (Xfinity)

09:33 received email from Opentable saying “Sorry we missed you at the restaurant”

10:00 weight myself – records the weight on the digital scale

10:17 received email from my bank asking why I transferred huge amount of money on Dec 8 and Jan 21

10:21 looked at my bank account HBSC App on my phone, bank tags last time I logged in.

10:34 opened a new word document, saved it several times on my laptop

10:45 downloaded the Txto app on my mac – browsed all your texts ready for printing.

11:00 watched French TV show on canalplus.com with login and password

A Day’s Worth of Data

I wake up at 9:00a, make breakfast, snap a picture of it on my phone and post it to Instagram with relevant hashtags. [Data generated: photographic data – which is also synced between my Dropbox as well as my iCloud, timestamp data, and social engagement data via likes on Instagram – note: I do not choose to geotag my photos, although who knows what data Instagram is actually relaying to its servers…] In the meantime, I catch up on the day’s headlines on NYTimes Now – creating data on the articles that I read, and the links that I click through.

I receive a few texts from a friend, as well as from a colleague who is going to meet up with me this morning to film some short scenes for a documentary. I reply to the texts, creating metadata (timestamp, to/from) and content within the texts – all donated to my wireless carrier and iMessage.

I meet up with the colleague, and we film around my neighborhood – her camera records video and time data. We also take a bus, and I swipe my Charliecard as I board, creating a few more data points on my bus usage – the stop I got on at, and perhaps how many times I’ve swiped within this month (I have a monthly pass instead of a top-up card).

After filming, I return home to answer emails, and work on rescheduling many meetings and other engagements that have been cancelled due to the snow storm. In the process, I generate data through my email conversations (text content + metadata + geolocation through my ip), and through my calendar updates (schedule content and time data on when changes are made).

Once I get hungry, I make lunch and Instagram it, again generating more photographic data, timestamp data, and social engagement data.

I return to working on my laptop, editing documents and spreadsheets on Google docs while collaborating with other students on a research project. I leave behind a data trail of my document edits – both the content and timing of the edits. In the process, I also get in touch with my collaborators via Gtalk – generating more text data and metadata.

Taking a small break before transitioning to my next work-related task, I log into Pinterest (a guilty pleasure!) and browse for a bit. I notice that Pinterest is now showing me suggested posts (instead of only the posts curated by the people I choose to follow), and I update my settings to suppress these superfluous pins. I realized that no user setting will get rid of the “picked for you” pins, and I use Google to attempt to find another workaround (creating search data) – however, this effort is not successful and I end up closing all of the tabs that I opened related to this break – and in the meantime, generating more browser history data.

Later on, I finalized a paper submission – this created a few updates to my Dropbox history as I completed some last minute document and content edits, and reformatted a few images. I submitted the paper, and generating data about my submission – both the actual content submitted, as well as the metadata of when I submitted, the file names and types that I submitted, etc.

I take another break to watch an episode of “Modern Family” on Hulu, creating data (linked, unfortunately, to my Facebook account – since at some point in history I had linked my Hulu and Facebook accounts together) on my viewing behavior, on which ads I watched, and also on my click behavior, as well as adding more to my browser history data.

I go back to emails again, sending more emails and generating more email and conversation history as I confirm the meetings that I have tomorrow.

Finally, as I’m writing this blog post, I’m generating data via the hyperlinks that I add, and also the content that I’m generating (metadata on the post category, revision data, as well as the actual text)!

Data Log

As I started this assignment, I was skeptical about how much data I would create, especially on a day in which I was not particularly busy. However, I quickly realized that passively, just through receiving texts and emails, I was already creating a substantial amount of data. I also realized, after looking back on the data I created, that, while there was a lot of data I created, it would be easy to misinterpret some of the data and end up with a relatively inaccurate guess about how I spent my day.


Data Log from 12am to 11:59pm on February 8th, 2015


12-1am

Watched YouTube videos

Sent/received >100 texts

1-2am

Watched YouTube videos

Sent/Received ~50 texts

2-3am

Watched TV

Watched YouTube videos

3-4am

Took pictures

Sent ~25 texts

Watched YouTube videos

Sent emails to ~50 people

4-5am

Logged out of Google account

Logged into different Google account

Edited 6 Google docs

Updated MIT mailing list

5-6am

Created Google doc and spreadsheet

Sent emails to ~10 people

Showered

Plugged in computer and phone

Set alarm for 10am

6-9am

Slept

9-10am

Received phone call

Wrote note on iPhone Notes App

Sent/received ~75 texts

10-11am

Snoozed alarm 3 times

Sent emails to about 100 people

Updated MIT mailing list

Deleted note on iPhone

Received phone call

Sent ~25 texts

Made 50 phone calls

11am-12pm

Swiped into MIT Dining Hall

Logged out of Google Account

Logged into Google Account

Logged out of Google Account

Logged into Google Account

Edited 2 Google Docs

Sent/received ~50 texts

12-1pm

Left dorm (footage on security cameras)

Turned on lights in class room

Received ~10 texts

3-6pm

Swiped into dorm

Received ~10 texts

6-7pm

Swiped into MIT dining hall

Sent/Received ~75 texts

Sent emails to about 1500 people

7-8pm

Went of Facebook

Logged out of Google account

Logged into Google account

Updated Google docs/spreadsheets

8-9pm

Printed ~12 pages

Updated MIT mailing list

Sent/received ~50 texts

Sent emails to about 50 people

9-10pm

Went of Facebook

Watched YouTube videos

Sent/received ~20 texts

Sent emails to ~50 people

10-11pm

Signed into Stellar

Downloaded 2 assignments from Stellar

Submitted assignment on Stellar

Set alarm for 11:59pm

11-11:59pm

Live streamed TV

Sent/received ~25 texts

Sent emails to ~100 people

Alarm went off


Totals for day:

Texts sent/received: >500

People reached via email: ~2000

Number of emails received: ~200

Phone calls made: 50

Phone calls received: 2

Number of different Google accounts signed into: 4

Data Log During the Snow-Pocalypse

How much data can really be logged on a snow day when you spend the whole day in one building and mostly on the same floor? Turns out quite a lot.

8:30 – My alarm goes off. I told someone I would meet them at breakfast by 9:00. I check my phone, read my emails, answer a few messages. The keyboard on my phone (Swift) requested permission to send back data about what I typed to its servers, so presumably it’s doing that the whole time. Google is reading my emails now, since it now shows me my flight information and other ‘convenient’ things, so it was probably doing that all night. I open up Clash of Clans to collect my gold and elixer that accumulated overnight – they’re probably tracking that as you can’t play the game without an internet connection. Apple probably actually collects data about my alarm going off, and wether I turned it off immediately or hit snooze – they already collect data about how far I walk, how many flights of stairs I climb, where I go, etc all day.

9:00 – I take the elevator down to breakfast. The elevator probably made note of the journey and possibly the weight somewhere, for maintenance purposes. I swipe my ID to get into dining – that action was definitely recorded and used by MIT, Bon Appetite, and was stored to prevent me from overeating my share of meals this week. I toast a bagel, as I do every morning. The cafeteria manager is probably keeping track of the total bagels consumed so that she knows how many to order in the next food shipment. I make tea with a Tazo teabag and she probably collects similar data about this too.

9:45 – I’ve finished breakfast and I go to do laundry. The laundry machine records my load, both for maintenance purposes (probably) and to deduct $1.00 from my TechCash account. The water and electricity usage is probably also recorded. I go back to my room to take a nap, not sure how much information about me can be recorded while I’m napping…

10:30 – I switch my clothes to the dryer (similar data is recorded as from the washer).

10:35 – I start working on my 6.046 pset. This includes many internet searches and the occasional facebook (or other form of social media) distraction. The websites that I view undoubtedly record my visit, and probably leave cookies in my computer too. It’s possible that they even recorded my keystrokes while browsing their site.

11:45 – I collect my warm clothes from the dryer. The laundry machine system is aware of this because it will now show that dryer as available in their online interface. I fold my clothes and continue with my pset.

1:00 – Lunch time! Normally I would venture out into Kendall or Central square to buy myself a sandwich with my debit card (while simultaneously contributing to data that the restaurants keep about their daily profit, number of customers, and most popular items), but today I eat a Luna bar and an apple I took from dining while in the company of my pset.

1:30 – I exchange text messages with a friend, asking him if he wants to work on the 6.046 pset with me. The data from that conversation was probably stored somewhere, maybe even by the NSA.

1:35 – My friend arrives and we work on the pset for a solid 2 hours together, talking things out and drawing pictures on paper. I’m not using my computer very much, but I will have to use LaTex to type up the answers at some point, and that will contribute to my computer usage data.

4:00 – It’s time for a break. I pull out my laptop again to watch an episode of Hulu before dinner. Hulu has a list of all of the shows I’ve watched, which ones are my favourites, and what it recommends for me, so my pset break definitely does not go unrecorded. After my episode finishes, I do a bit of internet browsing and get distracted by a cool new belt. Retailers love to collect data about me, so these actions did not go unnoticed either.

5:15 – Dinner time. I normally eat dinner much later, but because of my lackluster lunch, I got hungry early today. Anther elevator ride, another dining swipe, more data about me. During dinner we also get an email from MIT saying that Tuesday will also be a snowday, the dining hall is alight with excitement.

6:15 – I return from dining and open facebook again. I see adds for the belt that I had been viewing earlier, which means that my data went through as many as 3 companies: the original website, a third party advertising company, and now facebook.

6:30 – I return to working, but switch gears to finish up my 6.033 pset. After more googling and consulting a friend, I finish and submit my answers online. My submission was sent to a server somewhere probably in CSAIL so that the course staff can grade my answers.

7:30 – I decide to watch Unbroken with a friend, we’ve been trying to watch all the movies nominated for Best Picture. Since the movie is still in theatres and there’s a Massachusetts State of Emergency declared, we turn to the internet to provide entertainment. The site that we land on is no doubt full of malicious links and is trying to collect data on me for the next 2.5 hours, but it provides video nonetheless and we’re watching it through the incognito window.

10:00 – The night is no longer young, and I turn to reading and internet browsing (more cookies and advertising) for a long time before taking a shower (water usage), setting my alarms (apple data?) for the next morning, and going to bed.

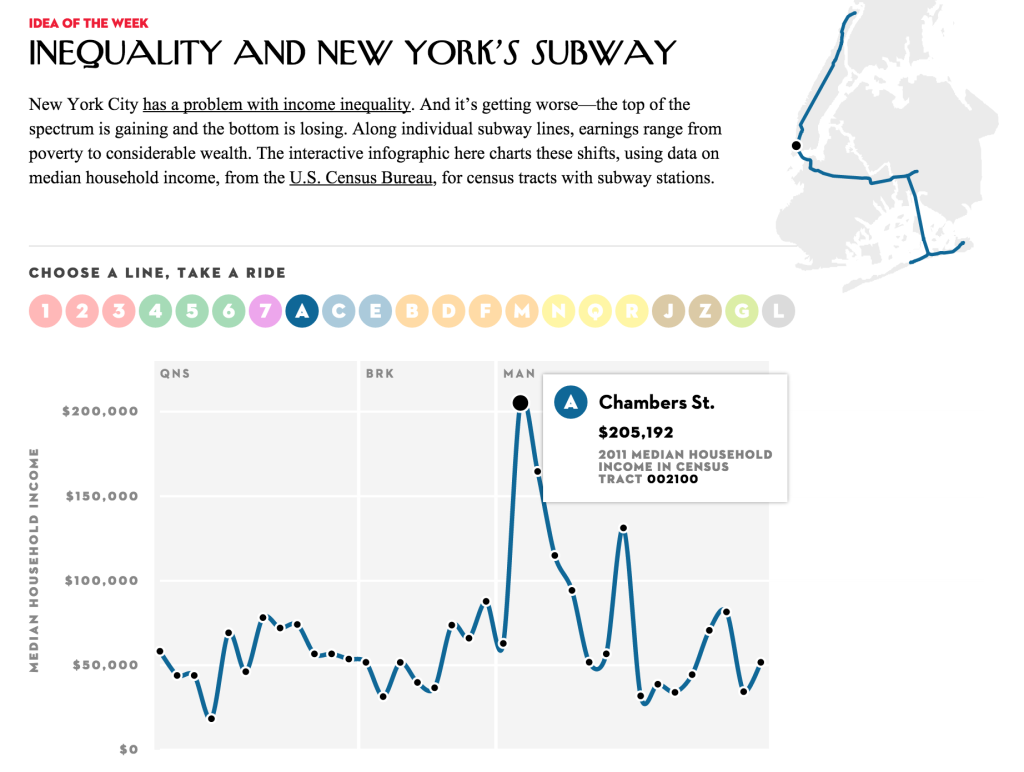
Using transit to visualize income inequality and census data

“New York City has a problem with income inequality. And it’s getting worse—the top of the spectrum is gaining and the bottom is losing. Along individual subway lines, earnings range from poverty to considerable wealth. The interactive infographic here charts these shifts, using data on median household income, from the U.S. Census Bureau, for census tracts with subway stations.”

http://projects.newyorker.com/story/subway


This New Yorker interactive is one of my recent favorites. The goal of this presentation of census income data goes beyond simply mapping income across the city. It presents income as a simple line chart, but in a more direct visual comparison than a heatmap would have done for the same information. The structure of the subway is used to orient the viewers and point them to the proximity of inequalities within the city. The differences between stops are dramatic, and their proximity is familiar to those who ride the subway.

This was a really effective presentation of data for me because of how prominently the subway system and other systems of transportation figures into our daily lives and serves to orient the way we see a city. Using only the tracts that have subways stops in them also eliminated a large part of the city. While this may seem to be a limitation at first, it actually serves to high-light income inequality, leaving a stronger impression of the data that inspires further investigation that can be applied to a larger area. It is also especially effective because it hints at the story of how infrastructure is tightly intertwined with income and that how the building of public transportation drives changes in income.

The readers of the magazine are the intended audience for this graphic, but it also expands the audience of the paper magazine to those with general interest in the city. There is a strong possibility of this visualization being used to present issues of inequality by community leaders, those interested in the changing landscape of real-estate by choose to use this format to map historical income data as well as projections of growth in the estimates given by the census.

Screen Shot 2015-02-05 at 2.56.56 PM

The grid in the background of this graph is categorized into the 3 boroughs that the train travels through. I think that the whole name of each borough could have been spelled out instead of using the 3 letter abbreviations. Overall the borough division shows the drastic increase in income in Manhattan versus other part of New York City and is especially effective. It would be harder to do this in other cities where inequality is less clearly delineated by geographic region.

For the L train, which bisects Manhattan before going across the river to Brooklyn(map lower right), the decline in income is especially clear(graph lower left).

Screen Shot 2015-02-05 at 3.22.33 PM Screen Shot 2015-02-05 at 3.22.38 PM


a day of data: 2/5/15

-8:30: my “eat breakfast, you degenerate” alarm goes off. my phone is synced with the cloud and collects metadata about my usage.  I grudgingly wake up and check my email while lying in bed (server access data; gmail usage; reply/deletion actions are recorded, and whoever I reply to knows I wake up around 8:30).

-8:50: i use the bathroom; i assume East Campus’ water usage is monitored in aggregate, so mine becomes part of the total.  to avoid waking my roommate, i do my hair and makeup in the communal bathroom instead of our room. my aim is to avoid creating any stimulus that will wake her, whether that be light or sound.  does that count as data?

-9:00: breakfast. i recycle the empty soymilk container and the box of cereal i just finished; to an enterprising investigator, trash could be considered a form of aggregate data about my hall’s eating habits.

-9:20: i head to class with my friend.  we leave footprints in the snow; my shoe size, footprint, and gait pattern are probably individually identifiable.  my phone has GPS enabled because my friends and i installed an app that pings my location to them, but i have (as i often do) left my phone in my bed.

-10:00: i ask a question in class. the girl next to me writes down the professor’s answer in her color-coded latex-ed notes.  i am also knitting a hat in class; its length is a linear function of time spent not completely engaged in class. one of my friends sitting near me sends me an email about my hat.

-11:00: i arrive at 6.046 lecture, which is being taped.  i spend the lecture knitting.  i don’t think i’m in the camera’s field of vision, though.

-12:30: i go to the course 6 lounge, using my ID to access, and make coffee.

-1:00: Japanese class.  i take a quiz; my score will presumably live in a spreadsheet somewhere and be used to calculate my grade.

-2:00: finally, a break.  i use my MIT ID to access my dorm, check my email, reblog a few posts on tumblr, and access facebook.  i don’t like anything, but i do click several links.  i leave my dorm and use my debit card to buy food at the food truck by MIT Medical.

-3:00: i head to CMS.631.  I check out links on my computer (internet browsing data), contribute points and ideas to the posters on the walls, which are going to be used to shape the course of the class.

-4:30: i go home (ID for access again).  my roommate is still asleep.  our electrical usage, which i have heard is tracked by room, is negligible except for the heater and various chargers for the day.

-5:00: i browse the internet and eat random food that belongs to me and i found in the freezer.  it has been a fixture in the freezer for a long time; the next person looking for food might be perplexed that a landmark they’ve come to rely on is gone.  there’s probably a ton of browsing data, tumblr reblogging, and email replies/deletions/reads.

-6:00: i decide it’s a great idea to work out instead of taking a nap. i used to use an app that tracked the miles i ran and the speed at which i ran; since it encouraged me to run as far as i could (and therefore get overuse injuries) i bring my phone with me only to listen to music. GPS is enabled, so my friends, if they wanted to know, are aware of my location.

-6:50: i have a 7 pm class.  i grab clothes from the shelves.  my roommate, if she was nosy (she’s super awesome and probably wouldn’t pry into my life that much), could deduce that i’ve worked out (gym clothes in my laundry bag and the shelves where my clothes live are a mess because i couldn’t find pants)

-7:00: i attempt to get into the Media Lab. i don’t have card access.  someone somewhere knows i tapped my card unsuccessfully about 3 times.  someone with access lets me in.

-7:45: my hat is longer. i’ve clicked several links on the class subreddit.

-8:30: we attempt to eat dinner with the housemaster.  card access to the west parallel of east campus.  all the food is gone. he is perplexed to see us.

-8:50: my friend invites me to dinner at maseeh.  i tap my ID again.

-10:00: i begin to attempt homework. many, many wikipedia pageviews, mostly linear classification and the perceptron algorithm. somehow i also end up reading up on the use of singular “they,” gender in news reporting, and ethics….meanwhile i’m listening to music on either pandora or youtube, who are definitely collecting data about my listening patterns and preferences, which are way more mainstream than i’ll ever admit to.  my youtube homepage is deeply embarrassing.

-12:00: i write out Japanese vocabulary on the chalkboard in the hallway.  people walking by after i go to sleep will know i was studying the meaning of “to see, honorific” and “space alien,” probably for a quiz tomorrow, because i talk a lot about how terrible i am at studying vocabulary.

-1:30: more tumblr; likes and reblogs. the books scattered on my desk explain, roughly, what i’ve been working on tonight. i write myself notes on my hand about the things i need to get done tomorrow. i set alarms to wake tomorrow, reply to some last emails, and fall asleep. the fact that the light is off in the room and the person-shaped lump in the corner inform my roommate that i’m trying to sleep, so she’s super stealthy when she comes in. those are the best kinds of data-driven decisions.

 

data log: Laura

My data log for Sunday Feb 8th.  The list includes only “collected” data–does data exist before it is recorded? (if a tree falls in the forest, does it make a sound?).

Some examples of non-recorded/non-observed data that I created include: vital signs, sleep habits, eating habits, actions, trash generation, movement patterns, items in my environment (e.g furniture), time use, products/consumables used, sewing machine use, radio use, newspaper/book reading speed, typing speed.

I also noticed that the amount of data I created on a very quiet weekend day at home was significantly less than the amount of data I created on a weekday working at school. Interacting with society creates more information!

Collected data includes:

–electricity use, gas use in the apartment
–gmail use throughout the day: receivers of messages, contents of messages, timing of receiving/sending/reading messages, amount of time spent per message
–online activities (chrome): sites visited, length of visit, times of visit, content, followed links, recirculated links…analytics blocker stops some of this data from collection?
–gchat conversations: person spoken too, content, timing,
–texting & calling friends & family: time of exchange, length of exchange, contents, rough location? (tracking is off, but cell towers or other methods?)
–google calendar: data of event, reshuffling of events, location of events