Data Hunt

Group: Val Healy, Tuyen Bui, Hayley Song

    For our data hunt, we chose to examine the 2013 Boston Employee Earnings dataset (https://data.cityofboston.gov/Finance/Employee-Earnings-Report-2013/54s2-yxpg). This dataset includes city workers’ names, title, department, earnings (broken down by type), and zip code.

One interesting finding is the seeming correlation between department and earnings. We (tentatively) found, by looking at the data, that Boston Police workers tend to be the highest paid city employees overall, with 44/50 of the highest paid workers being from that department. However, much of their earnings came from sources other than their regular pay, such as overtime, ‘other’, ‘detail’, and ‘quinn’.

We came up with three questions of the data, which are detailed below:

  1. How is the budget earnings allocation per department? Where is the money spent on people? Even though we noticed Boston Police workers seemed to be the “better paid”, when we look closer at the dataset, we can see that the Boston earnings budget is spent on Public Schools employees with over $600M VS $345M for the Boston Police Department. One way to understand it is that the Public Schools budget is high because it has to pay a higher number of employees (over 50,000 people).
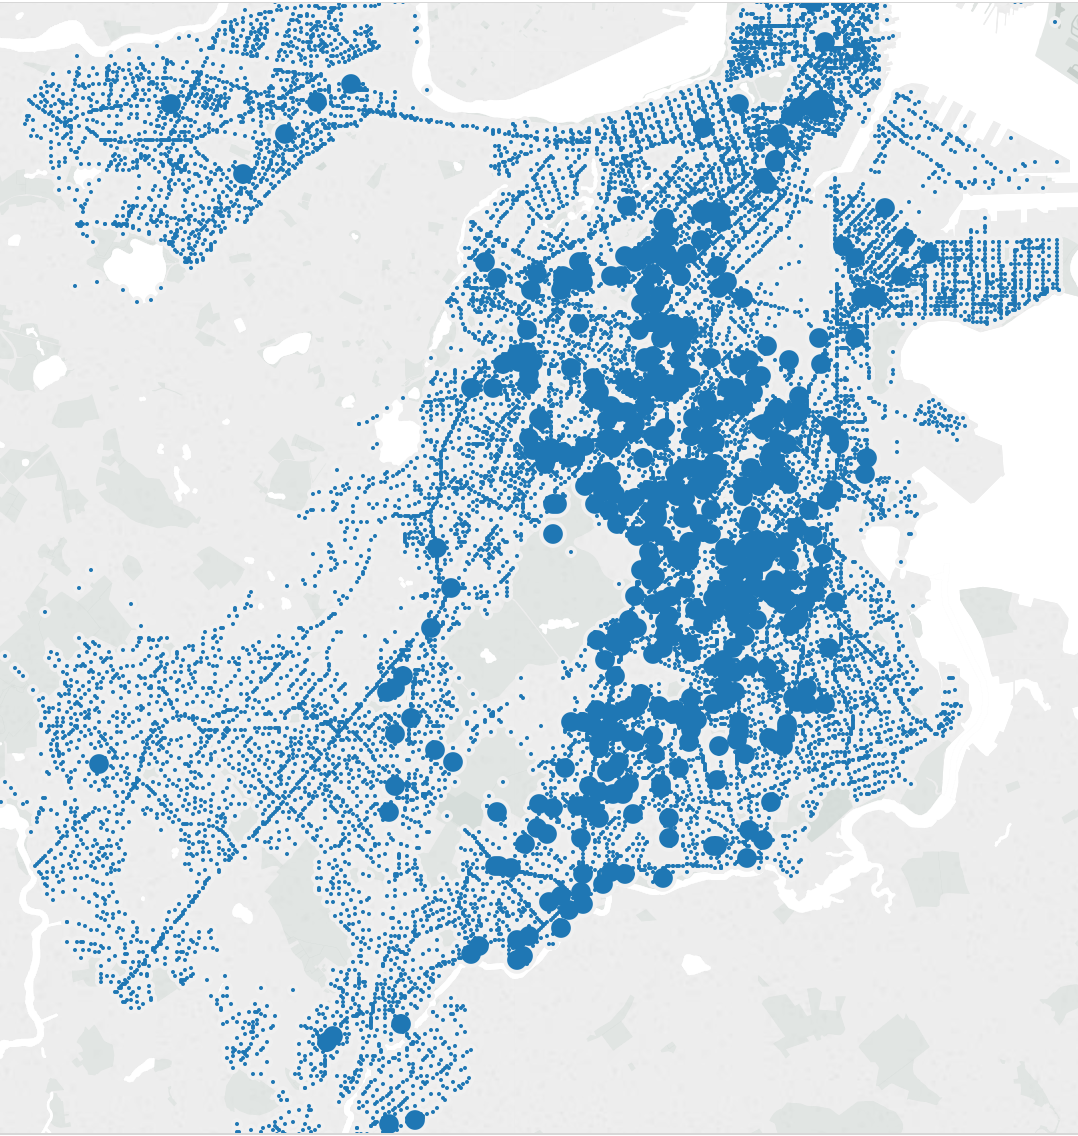
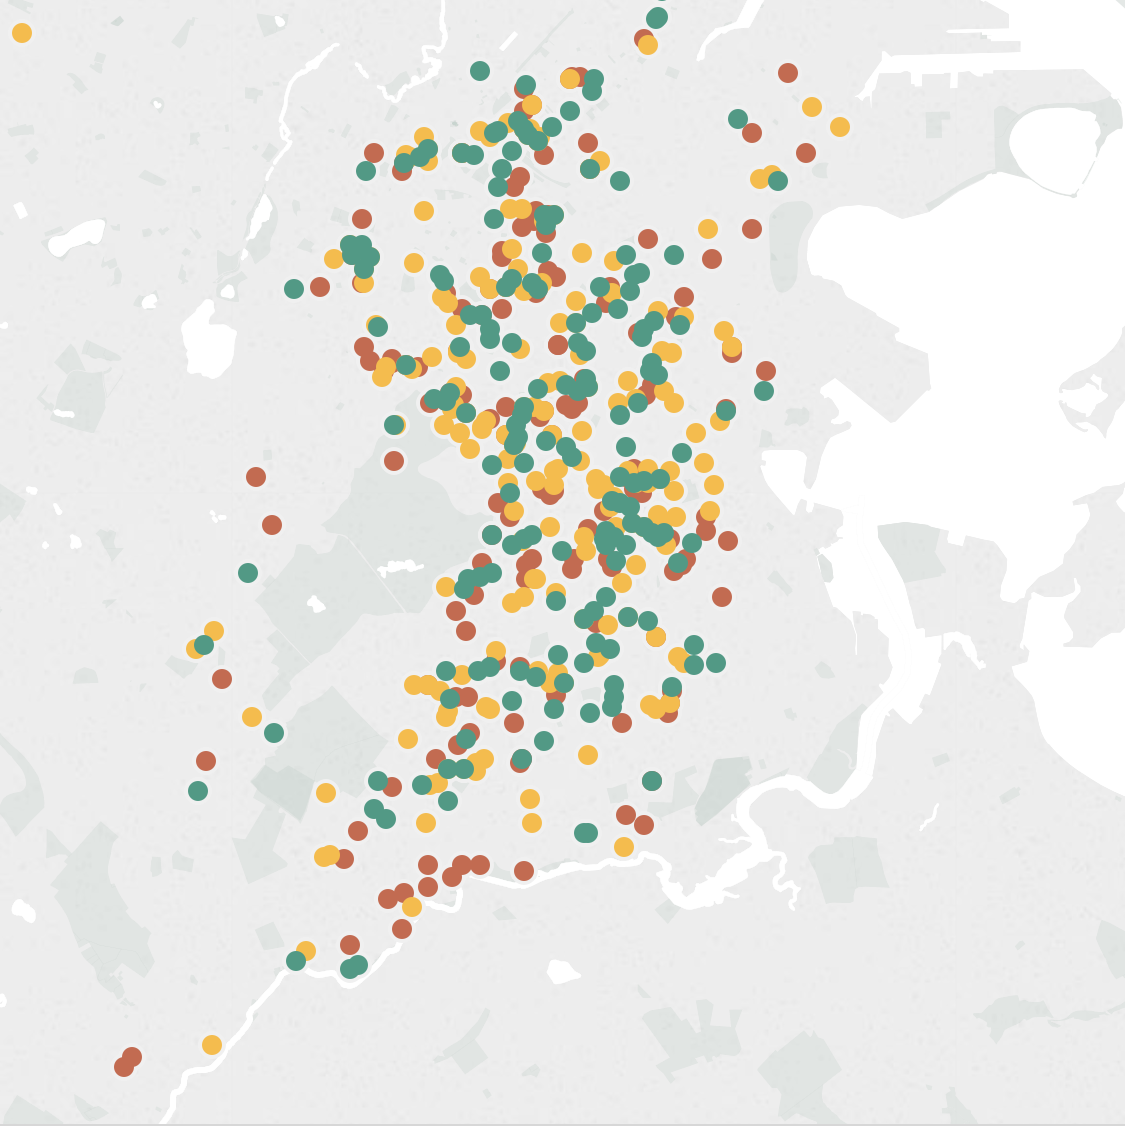
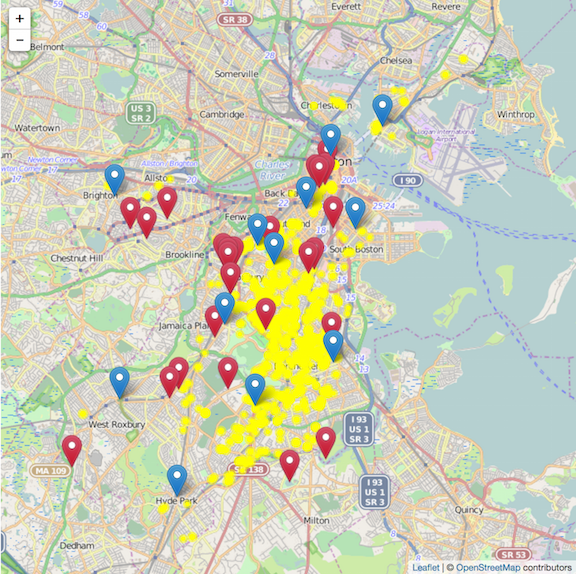
  2. We were also curious about the relationship between the incomes and places of residency.  We conjectured that different income levels would contribute to where people choose to live; we would like to see the distribution of locations of residency grouped by the income levels.  The report provides us enough information to answer this question: total earnings and zip codes.  First we need to sort the data by income and group them into four income levels: low, low-middle, middle-high, high.  We need to have some context in order to set the breakpoints for these four categories. We realized that it would be helpful to have data on Massachusetts’s annual average or median income in 2013.  We were able to find the data by querying U.S. Census Bureau’s database. Using the data, we can establish the range for each category. Then, we can scatter-plot the distribution of each group on the map of Greater Boston Area.  The map can be easily found online, but we prefer to use python’s Basemap and Matlibplot libraries with the appropriate longitude and latitude to display the distribution.
  3. Lastly, we were interested in visualizing the breakdown of the Boston Police employees’ wages, as much of their earnings were comprised of earnings outside of their regular pay. What percentage of their pay is due to overtime or other sources? Does this percentage vary by position? How do they compare? To accomplish this, we would take the data from all police employees, add up the numbers in each category, and produce a pie chart of the results. If we wished to break the numbers down further, we could separate the data by position and create a set of pie charts. All of this data can be sourced in the original data sheet.

School Gardens

Jia Zhang and Laura Perovich

The primary dataset we chose to investigate is the “School Gardens” (https://data.cityofboston.gov/Facilities/School-Gardens/cxb7-aa9j) dataset from the boston data portal. This dataset lists all schools in the Boston area that has a school garden.

 1. What is a school garden?(Rahul)

 We were wondering this ourselves. What does this dataset actually mean? It is helpful to created a visual dictionary of what school gardens are and for this we created a google map to zoom in on the different schools. It is hard to locate gardens, but what we found instead is that while the visual setting of these schools are diverse, we see a particular pattern. High schools are surrounded by parking spaces, middle schools by colorful markings on concrete.  With few exceptions, schools are enclosed buildings very much separated from the outside communities, they look protective. Some are even shaped so that buildings surround an inner outdoor play place.

A set of ground-level Images of the listed school gardens would further enhance the visual dictionary of school gardens.  These images could be requested from the schools, collected in person, or acquired online through school blogs, Google Image search, new articles, or Google street view. For example images of the Boston Latin School garden are available through a google images search leading to a press article:

http://blog.mass.gov/energy/education/boston-latin-school-honored-for-sustainability-health-environmental-education/

Without cleaning the data much, we made this preliminary map to better see the schools: Screen Shot 2015-03-02 at 9.29.11 AMhttp://www.mapcustomizer.com/map/schools%20with%20gardens

This map includes some obvious mistakes, but it is still very helpful for us to navigate and understand the data quickly. We have highlighted some of the interesting landscapes surrounding schools in the post itself.

Some interesting data/images(all from google maps):

At Boston Arts Academy, school gardens and community gardens are the most prominent in the school’s surroundings.

Screen Shot 2015-03-02 at 9.29.41 AM

At other school garden locations, the larger environment makes the schools look more isolated. Overall schools are L or U shaped concrete buildings with playgrounds for middle and elementary schools, parking lots for high schools and a line of trees at the borders of the property.

Screen Shot 2015-03-02 at 9.40.49 AMScreen Shot 2015-03-02 at 9.42.07 AMScreen Shot 2015-03-02 at 9.39.37 AMScreen Shot 2015-03-02 at 9.37.16 AMScreen Shot 2015-03-02 at 9.41.42 AMScreen Shot 2015-03-02 at 9.38.42 AMScreen Shot 2015-03-02 at 9.38.25 AMScreen Shot 2015-03-02 at 9.38.17 AMScreen Shot 2015-03-02 at 9.38.01 AM


Potentially we could analyze these images if we standardize the scale and zoom level to measure the percentage of greenery and gray concrete in each school’s environment. We could go beyond the idea of school gardens to address school settings in general.

2. Context – What % of schools have gardens and how do school gardens relate to other urban planting?

We saw right away that many of the schools on this list were elementary schools. We decided that it would helpful to get the context of school gardens by comparing our list to the list of public schools in Boston found at http://bostonpublicschools.org/.

We also thought it would be helpful to find how school gardens fit into the other urban planting around the city. Both community gardens (https://data.cityofboston.gov/Health/Community-Gardens/cr3i-jj7v) and urban orchards (https://data.cityofboston.gov/Health/Urban-Orchards/c7cz-29ak) are listed in the data portal and could provide context in how school gardens fit into the city’s greenery landscape.  Information on environmentally or ecologically focused businesses and non-profits in the area would also provide interesting contextual information.  A list of non-profits sorted by category can be found at

Screen Shot 2015-03-02 at 2.07.31 PM

http://www.mass.gov/anf/docs/hrd/policies/leave/nonprofit/approved-nonprofit.pdf.


3. Is a school garden an useful indicator of quality of education in a school?

In order to see if school gardens are built in schools with particular economic and academic profiles, we felt that it is helpful to compare the garden locations with both standardized testing scores and income data for the areas the schools are located. Although standardized testing is a heavily disputed measurement of the quality of education, we felt that it did offer a reasonable comparison to the garden data we found because of its comprehensive coverage. MCAS results by school can be procured online at: http://profiles.doe.mass.edu/.  This site also provides detailed information on the student demographics (race, gender), class sizes, student to teacher ratio, and teacher qualifications.  It also sorts schools by type–public, charter, private, etc.  This brings up an interesting question as to whether school gardens are useful indicators of the type of education offered at a school; from an initial scan it seemed that a number of schools on the list are charter schools. 

Similarly with income data, we felt the coverage and standardization of the census data on area income could be a helpful complementary dataset. The American Fact Finder’s (http://factfinder.census.gov/) income data by houshold can be found by selecting by area, and then by category at it’s data portal.
These datasets, starting with school gardens, but expanding to school environments in general would be helpful in potentially determining whether there was a correlation between the quality of education, wealth, and the quality of the school environment.

Boston Children’s Feeding Programs

Amy Yu & Ceri Riley

The primary dataset we looked at represents the locations of Children’s Feeding Programs in the Greater Boston area, ranging from after-school programs to those offered at community centers. According to the data (represented in this bar graph), there are only 19 total children’s feeding programs, many of which are concentrated in the Jamaica Plain region (4) and the Dorchester region (3).

Children's Feeding Programs

From this dataset, we came up with three questions:

1) Does the availability of children’s feeding programs correlate with outcomes such as childhood obesity rates?

Because children’s feeding programs most likely do not have the budget or resources to distribute large amounts of healthy food, we wondered if there were any regional correlations between areas with more children’s feeding programs and outcomes related to child health.

For this question, we found a dataset based on a Google search – a .pdf report about The Status of Childhood Weight in Massachusetts, 2011. Because this report resulted from a BMI screening of public school students in Boston, we can correlate the overweight/obesity statistics from schools within a certain region with the presence of children’s feeding programs. In addition, we could directly look at the difference between body mass indexes of children in a public school with a feeding program, contrasted with those of children in a nearby public school without a feeding program.

2) How does the geographic distribution of feeding programs for children compare to the distribution of food insecure households? How does it correlate with household income?

Our original dataset is also a good starting point to investigate the class question of food security, so we decided to look for data on the economic stability and food security of the various regions in the Greater Boston area. We found these datasets by searching on Google and the Boston City Data Portal.

The Report on Hunger in Massachusetts is a .pdf generated by Project Bread in 2013 that presents Greater Boston-area incomes in relation to average food costs, both of which can be correlated with the locations of the children’s feeding programs. The Food Security in US Households .pdf report was released by the USDA in 2013 to present data on food security nationwide, and we can look specifically at the Massachusetts and possibly Boston statistics to find the most relevant data. The final two relevant datasets are a spreadsheet of Economic Characteristics by Neighborhood 2005-2009 and a .pdf of Boston in Context from 2007-2011, both showing the economic status of specific regions of Boston which correspond to some of the regions where there are children’s feeding programs.

3) How many children are these programs reaching? Is there missing data that should be considered?

We wondered whether these feeding programs are located in areas where there are many children, and/or if they especially targeted areas with children that might need extra care already, for example those that have working parents. By searching on Google and the City of Boston Data Portal, we found several relevant datasets.

To find out the number and distribution of children in the Greater Boston area, we found an excel spreadsheet with the 2010 Census Data for Boston and a corresponding .pdf report describing Boston By the Numbers, Children and where most children live (Jamaica Plain is 6th out of 10 regions and Dorchester is 1st with about 4 times the number of kids). In addition, we found an excel spreadsheet of the types and locations of Day Camps in Boston, where parents might drop off their kids with or without prepared meals, to compare with the feeding programs dataset. And we also found a excel spreadsheet of all the Boston Public Schools to see how the number and locations of feeding programs correspond to the number and locations of all the public schools.

What are Ethical Uses of Data?

Ethical questions are critical to effective and responsible use of data.  Since they are often overlooked, I’ll be making special effort to weave conversations about ethics into each module of this course. There are no standards in the industry around ethics right now, thought there are many efforts underway.

In our review of Joel Gurin’s paper Open Governments, Open Data: A New Lever for Transparency, Citizen Engagement, and Economic Growth, students reflected on ethical questions related to three proposed scenarios.  Below is a short summary of their first set of responses to these scenarios.

Scenario 1: Big Data

a company is logging purchases made by each customer and using the transaction data to make personalized marketing efforts

The key questions discussed were about:

  • ownership – people could reasonably assume they own this information, not the companies
  • transparency – people often aren’t aware this data is being collected about them
  • secondary uses – this data is often sold to third parties to do analysis
  • unintended impacts – citing the famous Target “you’re pregnant” story
  • reinforcing existing filter bubbles – personalized marketing might reinforce purchase decisions that you don’t want to make anymore

Scenario 2: Open Data

a data analytics firm is analyzing social media sentiments towards a politician to gauge their electability

Here students were concerned about:

  • representativity – social media is seldom a reflection of society at large
  • trustworthiness – people often make this up
  • ownership / permission – people posting to social media often aren’t giving explicit permission to these uses

Scenario 3: Local Data

a city government is using a 311 phone service to monitor and resolve constituent concerns

The students had these questions about this situation:

  • trustworthiness – constituents could make fake reports to get people in trouble
  • anonymity – one students shared a story of poorly anonymized data
  • accuracy – many of the calls might be hard to categorize in their system, and their code-book might be inconsistently applied

Boston Police Data

Harihar Subramanyam & Danielle Man

We examined a number of datasets about police, shooting crimes crime, and emergency services in Boston. We primarily used the Crime Incident Reports dataset, which indicates the type and location of crimes in Boston. We cleaned the .csv data, separating the latitude and longitude into separate columns, with Python scripts.

We have three questions:

  1. How is shooting crime distributed around Boston?
  2. Do the locations of the police stations and hospitals make sense given the crime distribution?
  3. How does police violence (especially towards minorities) in Boston compare to other countries?

Question 1: Crime Distribution

Let’s look at the shooting crime distribution over time and location.

Let’s plot the shooting crimes on the map.

map_of_crimes
Map of crimes around Boston. Large blue circles are shooting crimes. Small blue circles are other crimes. See full visualization here

We notice that shooting crimes are not small in number and that they are clustered in central Boston. Now let’s map shooting crimes by year.

Map of shooting crimes by year. See the full visualization here.

It appears that the distribution has not changed much year to year.

Question 2: Police Stations and Hospitals

Now that we know where the shooting crimes are, let’s see if police stations and hospitals are optimally positioned to respond to them. To answer this question, we need more datasets. The Boston Police District Station and Hospitals Locations datasets give the names and locations of the Boston police stations and hospitals, respectively.

The map below shows that the hospitals (red) and police stations (blue) form a ring around the cluster of shooting crimes and are within one mile of almost every shooting crime.

Hospitals are red and police stations are blue. They form a ring around the crime cluster. See the website here.

Hospitals are red and police stations are blue. They form a ring around the crime cluster. See the website here.

Question 3: Police Violence

Finally, given that police violence is a growing concern in the U.S., let’s look at how Boston compares to other cities. Again, we need more data, so let’s look at Fatal Encounters.

Killings by state. For the full visualizations see here.

Killings by state. For the full visualizations see here.

We notice that Massachusetts does not stand out compared to other states. Looking at counties shows that Boston has fewer killings than almost all other large cities – see here.

Finally, we focus on Boston and look at the number of killings based on race, gender, and symptoms of mental illness.

Distribution of fatal encounters.

Notice that primarily men are killed, but that the distributions seem to be similar over the races.

Conclusion

We started with the crime incident dataset and combined it with other data (hospitals, police stations, and Fatal Encounters) to pose questions about crime distribution, police/hospital response, and police violence. With some visualizations, we explored the questions and discovered some interesting factoids. For example, hospitals and police stations form a ring around the cluster of crimes and police violence in Boston is not as extreme as in other cities.

Further exploration of these datasets, and perhaps other datasets, can help answer our questions.

data mural

The process we used to create the data mural was definitely different from the design meetings I attend weekly on visualization projects in my research. Most projects that we visualize are more data heavy and less illustrative because the points we want to include in particular visualizations often dictated the visual forms and complexity we needed to represent. I think that there is a tendency to focus on the quantity and quality of data in my own design processes rather than starting with small snippets of anecdotes and stories.

I am surprised how well and cleanly the ideas for the murals came together given the short amount of time. I think this is the result of following the data journalism handbook’s points. We translated the looking for key terms step into a real time activity by using post-its and were able to construct a story that is true to the preliminary data quickly. We did not pursue a lot of the other more time consuming tasks, such as going through and curating the data ourselves, which if time allowed I would liked to have done.

Painting with Data

While I have prior experience designing data-driven stories, creating the Food For Free data mural was dramatically different from the design processes I was used to. As laid out in the Data Journalism Handbook, my typical process involves querying a data set to answer specific questions or identify outliers and interesting patterns. Brainstorming for the mural felt a lot less structured, more akin to the “blue sky” ideation of early stage product design (what I like to call “brain vomit”). The narratives we created — while derived from a structured typology of different data stories — were distilled to far broader big picture ideas when we translated them into visual language, perhaps because this was presented as a creative artwork rather than a quantitatively-focused chart/graph.

I did like the concept of drawing for a short period of time and then passing it on; not only did this process promote the creative “piggybacking” you see in a typical group brainstorming session, but it also allowed us to see which common thematic strands kept popping up to create a more consensus-driven design. The resulting artwork is more based on visual metaphors and symbolism rather than the design techniques of narrative visualization identified in Segel & Heer’s case studies. However, the mural still uses basic design principles of alignment, sizing, and color to achieve the more general tactics of visual narrative (structure, highlighting, and guidance).

This experience helped expand my definition of what a data visualization could be; there are definitely opportunities to be creative with the data presentation. My one criticism of the medium is that the data doesn’t always feel entirely integrated with its presentation. Sometimes, it felt like we were just adding numbers to the artwork as an afterthought. There is a distinction between the fields of art and design, and to me this mural definitely felt more like data art than data design — and not just because we were painting. That’s not to say that a mural is any less valuable or less informative, but we certainly took more artistic liberties and the result feels far more subjective than I’m used to.

Painting a Food for Free Data Mural

We finished out Data Mural process by painting the mural we designed together!

IMG_6189

After finding the data-driven story we wanted to tell and then collaboratively sketching out the mural, it is great to see it finished!

Special guest Emily Bhargava helped turn the sketch I created into a design on a large tarp.  Then we all worked together – some finalizing the data to include while others painted:

hands

Here is the final picture:

food-for-free mural


Design Process

I found our story finding and visual design process fun and surprisingly similar to processes that I have used before for design brainstorming – I guess theres a reason such sticky note techniques are widely used by designers 🙂

Last semester I took a class called Engineering Innovation and Design. As a brainstorming exercise for our final project, we were told to get into groups, grab a bunch of sticky notes, and then write down the first things that came to our mind. We proceeded to put these on the blackboard, cluster them, name our clusters, and work off each others ideas just like we did in our class.

Similarly, over IAP I had the opportunity to brainstorm and prototype a new feature for the company I was working at. In our very first meeting, the head of UI/UX at the company explained the problem, what we were hoping to accomplish with this new feature, and then proceeded to hand me a whiteboard pen. The three of us in the room spent the next hour repeating the process of ‘draw for 5 minutes, talk for 10min,’ and by the time we left the room we had sketches that encompassed about 90% of what the final feature ended up being.

Thinking back now, this process of rapid brainstorming with sticky notes and whiteboard pens is something that I’ve done whenever encountered with a new UI/UX problem. When it comes down to it, I think that data visualization is highly correlated with UI/UX, because you’re taking something that’s otherwise unreadable and trying to make it attainable and emotion eliciting from your readers.

Story Finding – Photography vs Murals

As a former photography editor for The Tech, part of my job included taking a series of photos from different event, whether it be a campus performance or a demonstration in Harvard Square, and turning it into a story that makes sense to the general audience. Most events tend to be summed up into just one picture, though there are other instances where multiple photos from the event are run as a “photo spread”. Things I had to consider included the usual what/when/where of the photo, but also (and most importantly) why the event pictured was happening and its relative importance compared to the other photos submitted for the current issue. This is process was repeated on a) all photos submitted for an event and b) all photos that are selected for each event for the issue, to determine placement in the issue. My goal was to create an accurate and relevant presentation of various events that are interesting and relevant to the MIT audience.

Compared with our story finding process for the Food for Free Mural, we were given a dataset with information about Food For Free’s work over the last few years, and an insider perspective on how it works and why it’s important. From this information, we cherrypicked what we considered the most important and formulated sentences that were then joined to create a cohesive story.

These processes, though dealing with different kinds of “data”, were not all that different — both involved some sort of cherrypicking, or narrowing down of the information that was available — while still trying to get a good “picture” of what is going on. Another process not talked about here is the development of the visual design – the designing of photo spreads also has similarities to our process for designing the mural.